EUR/GBP clinches 5-month tops beyond 0.8900
|- EUR/GBP moves higher and prints tops above 0.8900.
- Sterling weakens following poor docket.
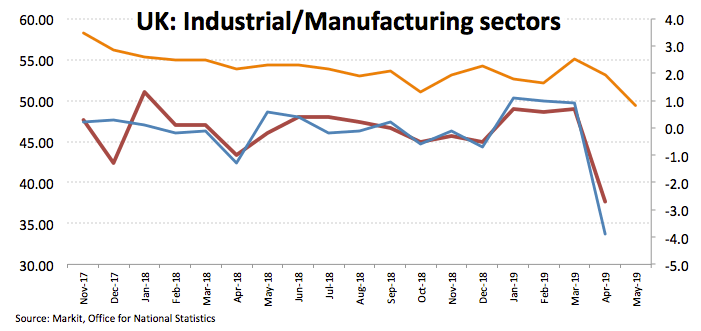
- UK Manufacturing Production contracted 3.9% MoM in April.
The selling bias around the British Pound has intensified today and is now helping EUR/GBP to record fresh multi-month peaks beyond 0.8900 the figure.
EUR/GBP higher post-UK data
There is no respite for the Sterling, either on the political front or domestic fundamentals.
Sellers regained the upper hand around GBP today in response to the weaker-than-expected results from the UK docket.
In fact, Industrial Production contracted at a monthly 2.7% during April and Manufacturing Production dropped 3.9% inter-month, both prints surprising markets to the downside. In addition, Construction Output contracted 0.4% MoM and monthly GDP figures showed the economy contracted 0.4% during the same period.
On the brighter (ish) side, the trade deficit shrunk to £12.11 billion in April.
In the meantime, the European cross has started its sixth consecutive week in the positive territory, already gaining around 5% since early May lows in sub-0.8500 levels.
What to look for around GBP
Heightened uncertainty around the Brexit negotiations and May’s successor keeps the pressure on the Sterling intact for the time being. Back to the UK economy, today’s miserable prints from the UK industrial and manufacturing sectors have added concerns over the prospects for the economy in months to come and also poured cold water over the recent squeeze higher in GBP. Additionally, the current steady stance from the Bank of England appears justified by below-target inflation figures, downbeat results from key economic fundamentals and somewhat slowing momentum in wage inflation pressures, all adding to speculations of a ‘no-hike’ this year despite some calls signalling a potential hike in November.
EUR/GBP key levels
The cross is gaining 0.13% at 0.8905 and a break above 0.8906 (monthly high Jun.10) would expose 0.9062 (low Jan.11) and finally 0.9092 (2019 high Jan.3). On the other hand, immediate contention aligns at 0.8826 (low Jun.5) seconded by 0.8780 (200-day SMA) and finally 0.8724 (low May 21).
Information on these pages contains forward-looking statements that involve risks and uncertainties. Markets and instruments profiled on this page are for informational purposes only and should not in any way come across as a recommendation to buy or sell in these assets. You should do your own thorough research before making any investment decisions. FXStreet does not in any way guarantee that this information is free from mistakes, errors, or material misstatements. It also does not guarantee that this information is of a timely nature. Investing in Open Markets involves a great deal of risk, including the loss of all or a portion of your investment, as well as emotional distress. All risks, losses and costs associated with investing, including total loss of principal, are your responsibility. The views and opinions expressed in this article are those of the authors and do not necessarily reflect the official policy or position of FXStreet nor its advertisers.