Yearn.Finance Price Prediction: YFI looks poised for a breakout towards $20,000
|- YFI is currently trading at $14,447 and has broken out of a significant 12-hour chart pattern.
- Continuation of the recent bullish breakout can drive YFI towards $20,000.
YFI has been trading inside a massive downtrend since September 12 and formed a head and shoulders pattern that broke bearishly. After losing close to 70% of its value over one month, the digital asset seems ready for a massive rebound.
Can the breakout be sustained?
On the 12-hour chart, a descending triangle formed since October 8 has just been broken. Although YFI hasn't seen a lot of continuation just yet, the breakout is notable. The MACD has remained bullish since October 8, and the RSI is not even close to overextension.
YFI/USD 12-hour chart
It also seems that the Bollinger Bands have squeezed significantly over the past three days, indicating that a major move is underway. Before the final price target of $20,000, bulls are eying up $17,000, which is the 50-SMA on the 12-hour chart.
YFI Holders Distribution
 [17.18.58, 23 Oct, 2020]-637390636268315209.png)
Additionally, looking at the holders distribution chart provided by Santiment, we can observe a decent spike in the number of whales holding between 100 and 1,000 coins, jumping from 14 on October 16 to 18 currently. This metric adds even more fuel to the recent bullish breakout.
The other side of the coin
Despite the bullish breakout above the descending triangle pattern, bulls are still facing some hurdles above. The 4-hour chart shows a strong resistance level in the form of the 100-SMA at $15,000, which almost coincides with the upper Bollinger band.
YFI/USD 4-hour chart
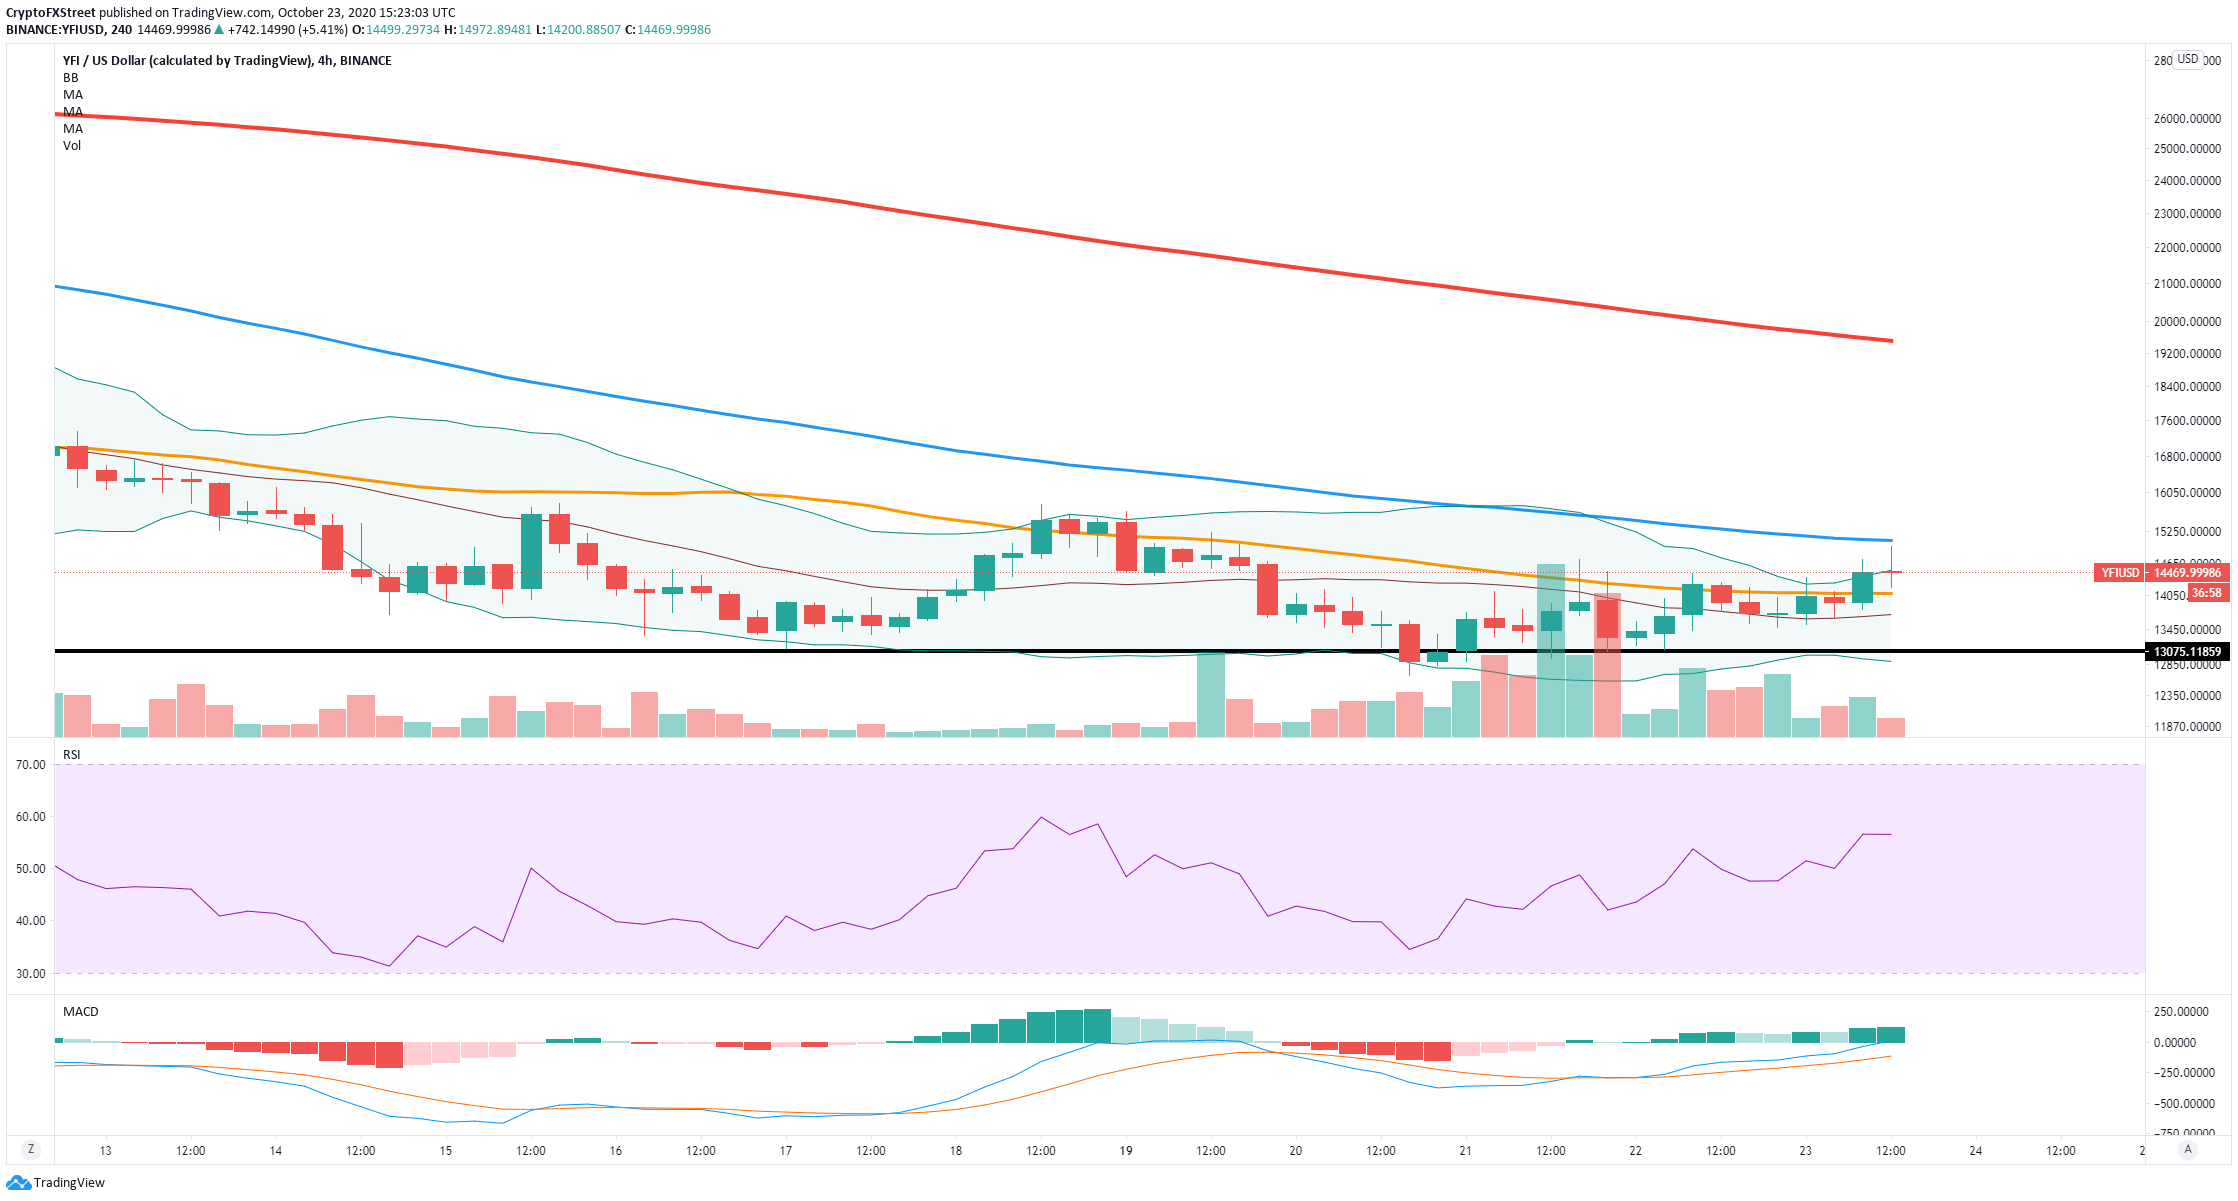
The 100-SMA has rejected the price already, which is now trying to hold the 50-SMA. A breakout below the 50-SMA at $14,000 could drive YFI down to the support level at $13,000, which coincides with the lower Bollinger band.
YFI IOMAP Chart
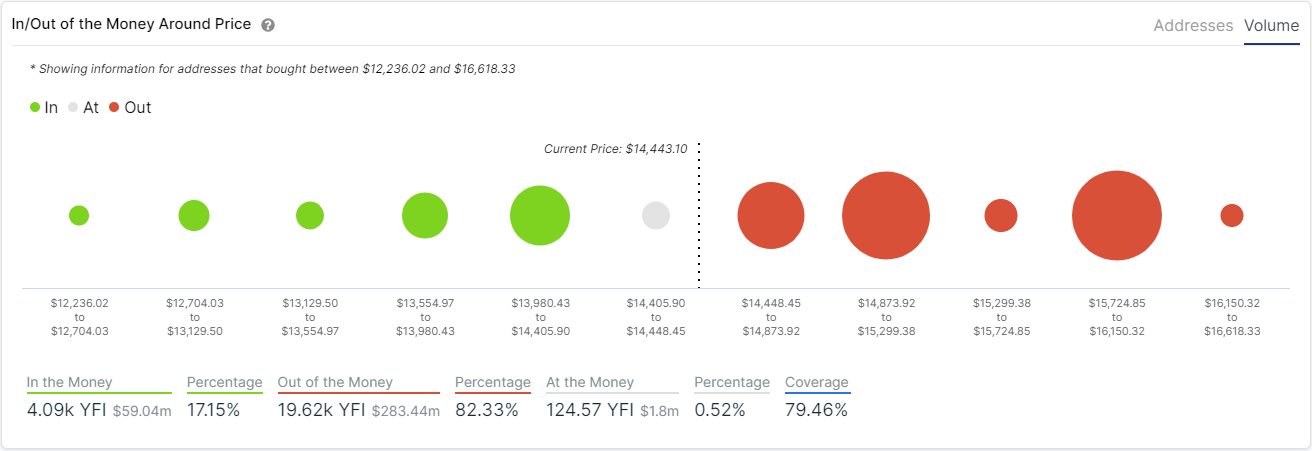
The In/Out of the Money Around Price chart shows very little support to the downside compared to the resistance ahead. The most notable support level is around $14,000, which supports the theory that a breakout below this point would be substantial.
Information on these pages contains forward-looking statements that involve risks and uncertainties. Markets and instruments profiled on this page are for informational purposes only and should not in any way come across as a recommendation to buy or sell in these assets. You should do your own thorough research before making any investment decisions. FXStreet does not in any way guarantee that this information is free from mistakes, errors, or material misstatements. It also does not guarantee that this information is of a timely nature. Investing in Open Markets involves a great deal of risk, including the loss of all or a portion of your investment, as well as emotional distress. All risks, losses and costs associated with investing, including total loss of principal, are your responsibility. The views and opinions expressed in this article are those of the authors and do not necessarily reflect the official policy or position of FXStreet nor its advertisers.