Top 3 Price Predictions: Bitcoin ready target $7,471, Ethereum eyes $580, Ripple could roar to $0.7063 – Confluence Detector
|- Bitcoin, Ethereum, and Ripple managed to stabilize after suffering a blow over the weekend.
- The three cryptocurrencies now have clear upside targets.
- The Confluence Detector shows clusters of technical levels according to their importance.
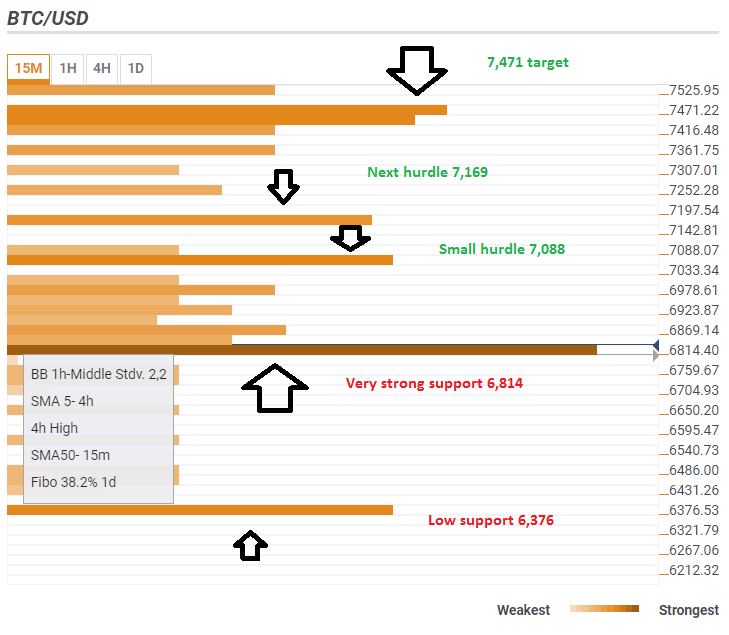
BTC/USD has strong support, targets $7,471
The price of Bitcoin has support at $6,814 which is the congestion of potent lines such as the Bollinger Band 1h-Middle, the Simple Moving Average 5-4h, the 4h-High, the SMA 50-15m, and the Fibonacci 38.2% one-day. The considerable cushion should allow the pair to advance.
The first notable upside hurdle is the $7,088 which is the confluence of the Pivot Point one-day, Resistance 3 and the one-month low. Further above, $7,169 is the meeting point of the Pivot Point one-week Support 2. However, BTC/USD targets the $7,471 level which is the convergence of the SMA 10-one-day, the Fibonacci 23.6% one-week, the SMA 200-1h, the SMA 50-4h, the SMA 100-4h, and the Bolinger Band one-day-Middle.
To the downside, low support awaits at $6,376 which is the Pivot Point one-month Support 1. As mentioned earlier, the robust support at $6,814 should prevent a fall to lower ground.
This is how it looks:
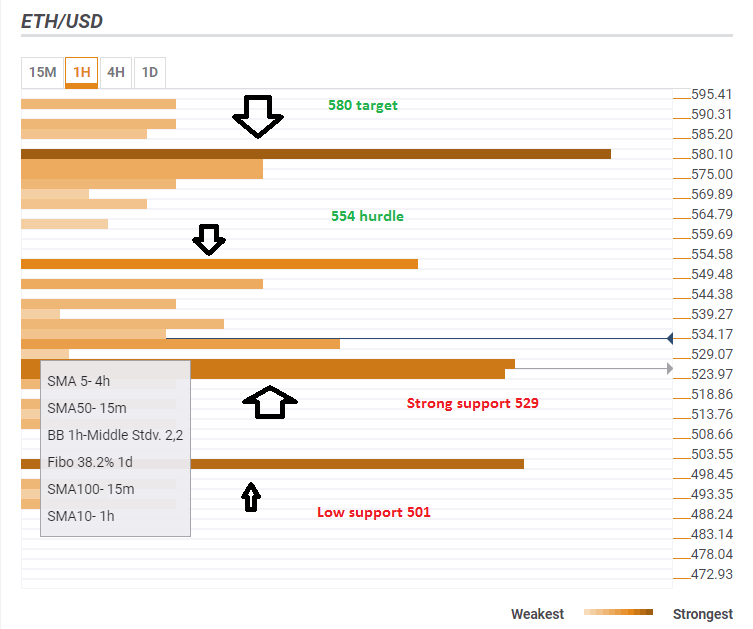
ETH/USD found a solid base, now seeks reaching $580
Similar to Bitcoin, the Ethereum Price has a solid base at $529 which is the congestion of the Simple Moving Average 5-4h, the SMA 50-15m, the Bollinger Band 1h-Middle, the Fibonacci 38.2% one-day, the SMA 100-15m, the SMA 10-1h, the Bolinger Band one-day Lower (Stdv. 2.2), and the Pivot Point one-week Support 1.
It would be easier to move to the upside with a first target at $554 which is the meeting point of the Pivot Point one-week Support 2 and the PP one-day Resistance 2.
The real target is $580 which is the congestion of the potent Simple Moving Average 100-4h, the Bolinger Band one-day Middle, the Fibonacci 23.6% one-month and the one-week low.
A potential drop of the pair would send it to secure support at $501 which is the Pivot Point one-day Support 2 and the one-month low.
Here is how it looks:
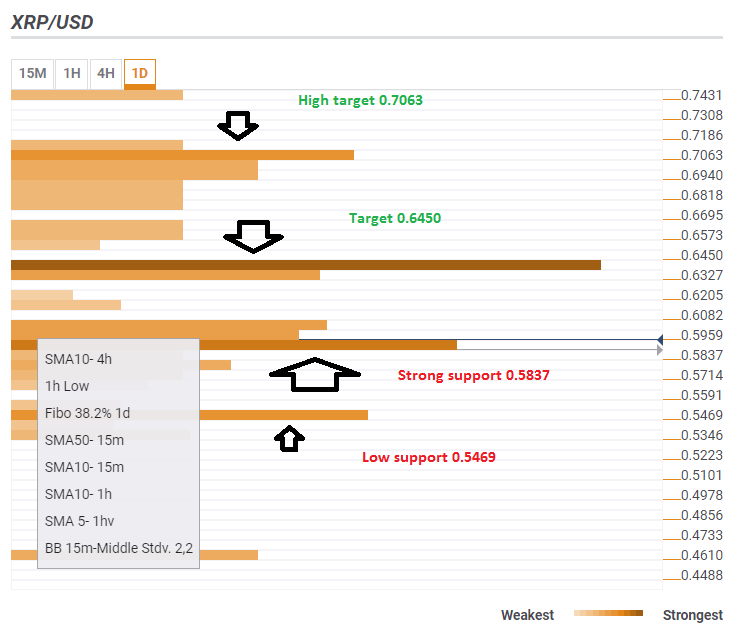
XRP/USD sets its eyes on $0.7063
The price of Ripple.also enjoys significant support at $0.5837 which is a dense cluster of lines: the Simple Moving Average 10-4h, the 1h-Low, the Fibonacci 38.2% one-day, the SMA 50-15m, the SMA 10-15m, the SMA 10-1h, the SMA 5-1h, the Bolinger Band 15m-Middle, the Fibonacci 161.8% one-week, the SMA 5-15m, the SMA 50-1h, the SMA 200-15m, the Fibonacci 23.6% one-day, and many more.
This congestion should allow XRP/USD to rise and reach out towards the first target of $0.6450 which is the confluence of the one-week low, the Fibonacci 23.6% one-month, the Pivot Point one-week Support 1, the Bollinger Band one-day Middle, the Pivot Point one-day Resistance 2, the SMA 100-1h, and the SMA 100-4h.
Further above, $0.7063 is the convergence of the Bolinger Band 1h-Upper, the Bolinger Band 1d-Upper, and the one-week high.
On the other side, $0.5469 is the meeting point of the one-month low, the Pivot Point one-day Support 1, and the Bollinger Band one-hour Lower.
This is how it looks:
The Confluence Detector finds exciting opportunities using Technical Confluences. The TC is a tool to locate and point out those price levels where there is a congestion of indicators, moving averages, Fibonacci levels, Pivot Points, etc. Knowing where these congestion points are located is very useful for the trader, and can be used as a basis for different strategies.
This tool assigns a certain amount of “weight” to each indicator, and this “weight” can influence adjacents price levels. These weightings mean that one price level without any indicator or moving average but under the influence of two “strongly weighted” levels accumulate more resistance than their neighbors. In these cases, the tool signals resistance in apparently empty areas.
Information on these pages contains forward-looking statements that involve risks and uncertainties. Markets and instruments profiled on this page are for informational purposes only and should not in any way come across as a recommendation to buy or sell in these assets. You should do your own thorough research before making any investment decisions. FXStreet does not in any way guarantee that this information is free from mistakes, errors, or material misstatements. It also does not guarantee that this information is of a timely nature. Investing in Open Markets involves a great deal of risk, including the loss of all or a portion of your investment, as well as emotional distress. All risks, losses and costs associated with investing, including total loss of principal, are your responsibility. The views and opinions expressed in this article are those of the authors and do not necessarily reflect the official policy or position of FXStreet nor its advertisers.