Theta Price Prediction: THETA poised for a healthy pullback before resuming uptrend
|- THETA has hit a new all-time high at $0.76 and continues trading in price discovery mode.
- A short-term correction seems to be on the menu for the digital asset according to several indicators.
THETA has been trading inside a robust uptrend for the past four months and hit a new all-time high at $0.76 on September 28. Its market capitalization has grown from $46 million on March 16, to a current high of $640 million.
Bears looking for a correction after a strong sell signal was presented
Just over the past five days, THETA is up by more than 36%. Many investors are wondering when the next correction period will start. According to several metrics, it seems to be nearby.
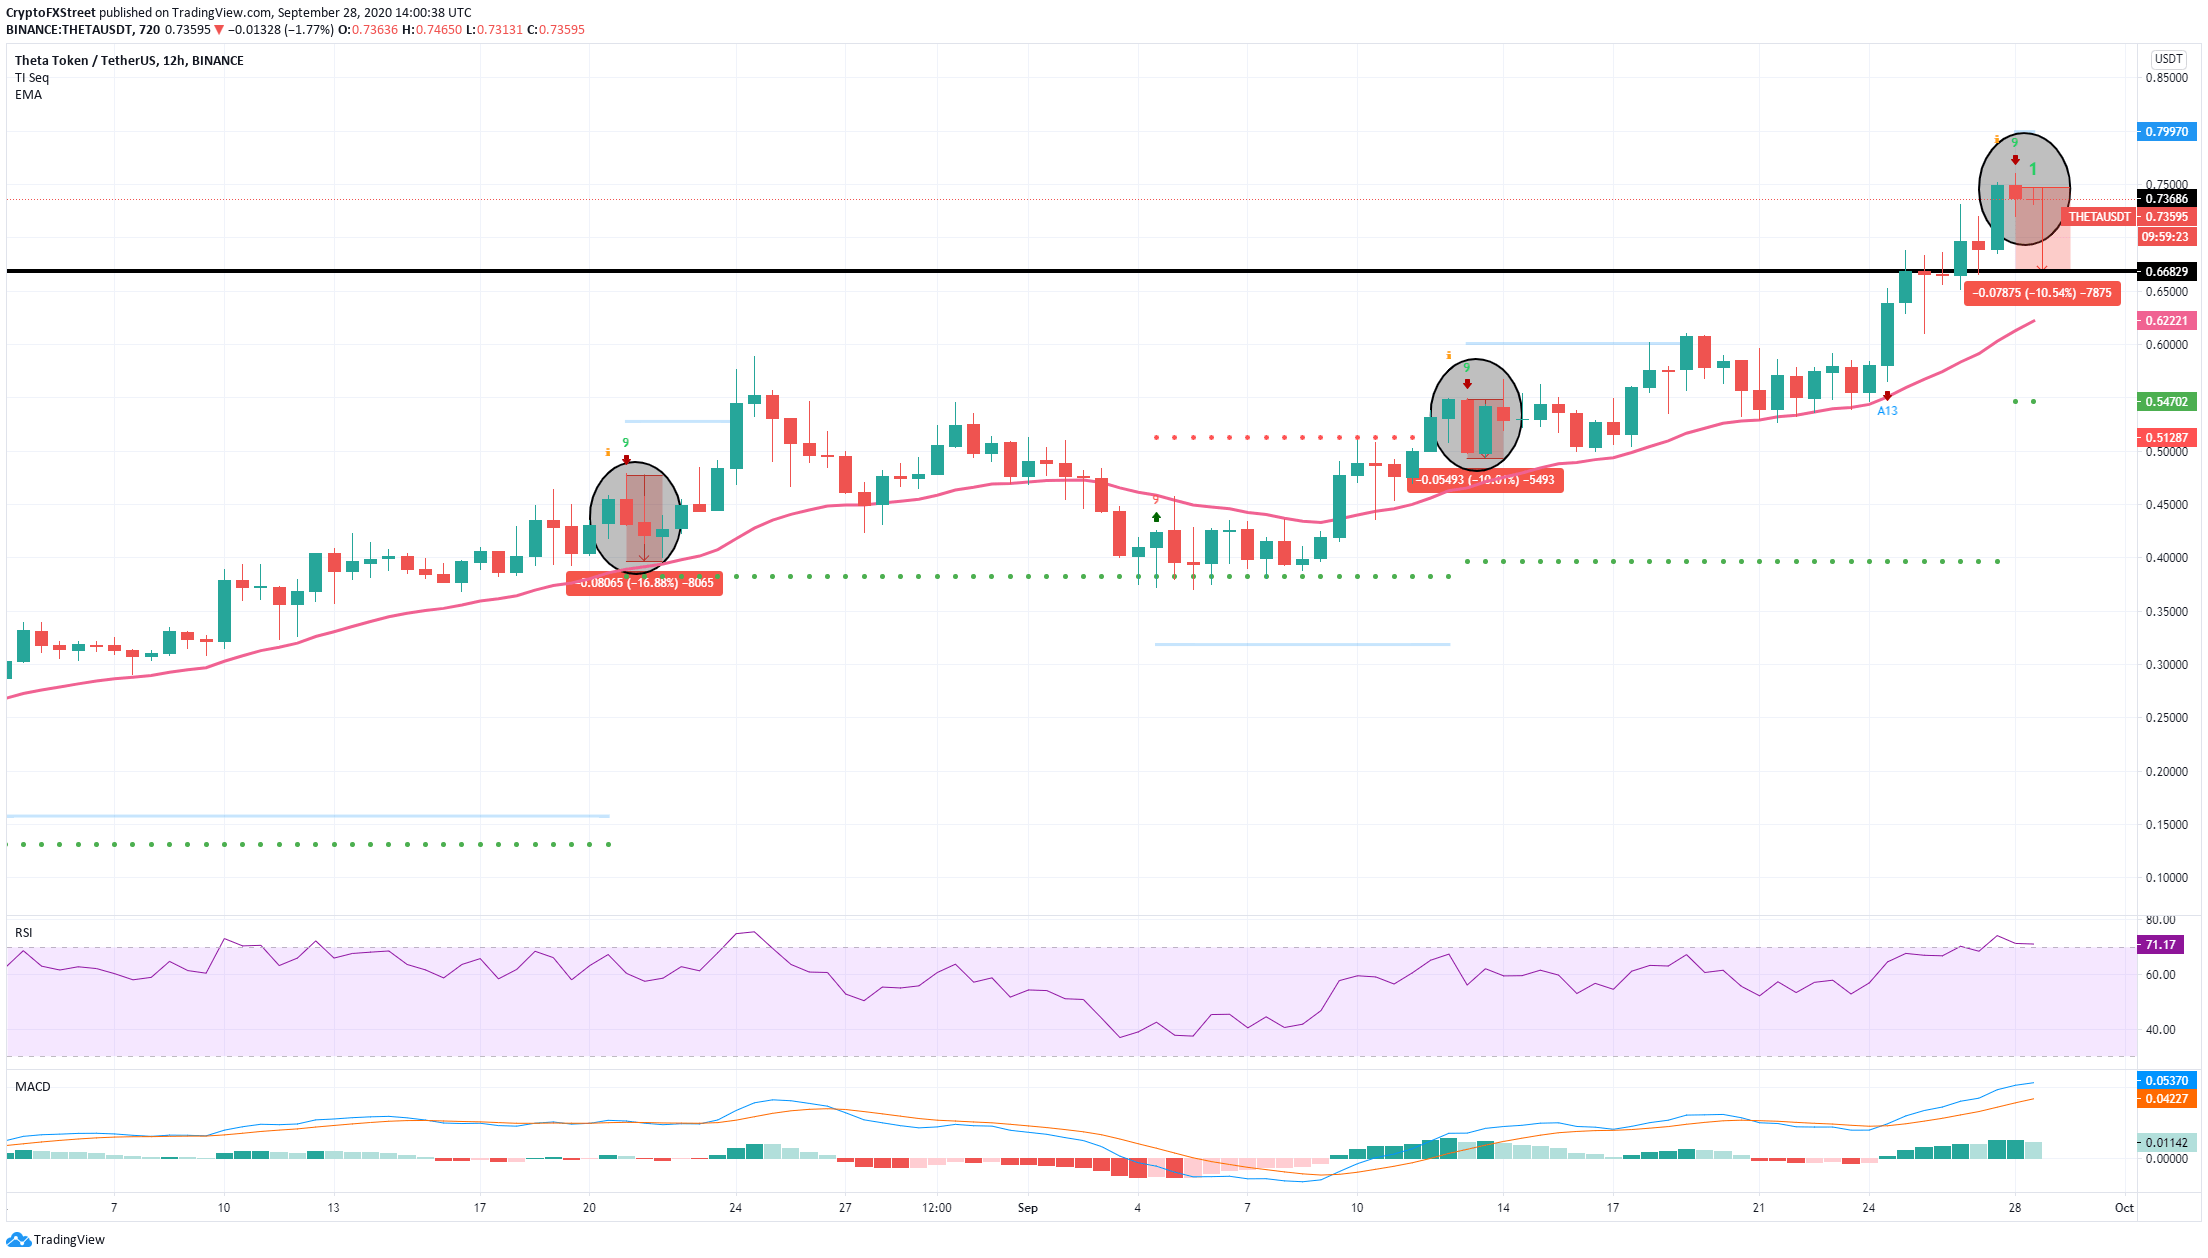
THETA/USD 12-hour chart
On the 12-hour chart, the TD sequential indicator has just presented a sell signal at around $0.75. If we look at the past two signals, they were both validated and followed by a 17% correction and 10% after the last one. The RSI has been overextended since September 27. Historically, this indicator has also been entirely accurate in showing upcoming correction periods for THETA.
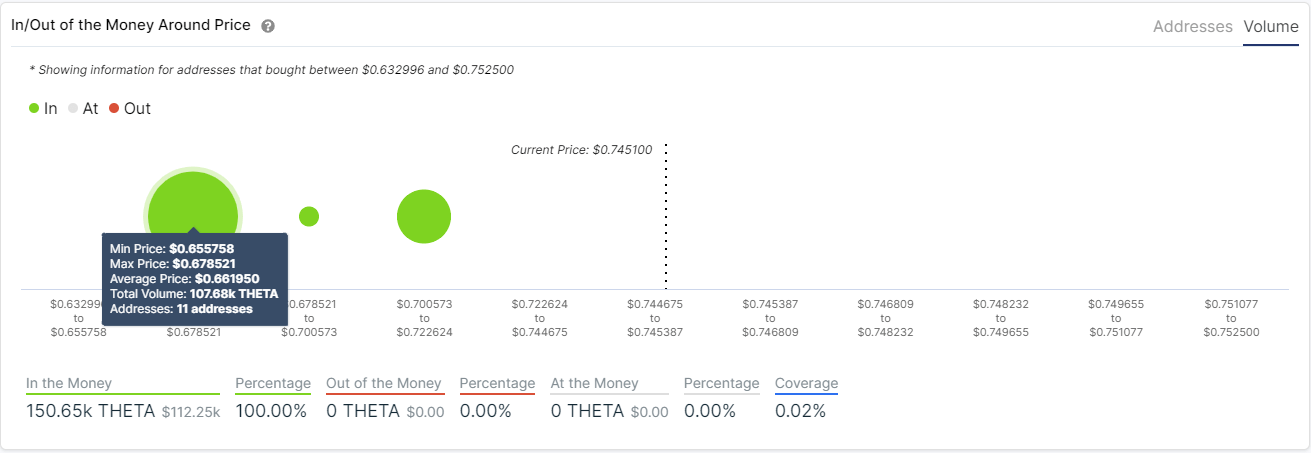
THETA IOMAP Chart
Another 10% pullback would take THETA down to $0.66. The In/Out of the Money Around Price chart by IntoTheBlock indicates that $0.66 is indeed a vital support area. We can see that between $0.65 and $0.67, around 107,000 THETA was bought, which is notable considering the digital asset is trading at all-time highs. Lower than this support level, bulls could find a good support point at $0.62 in the form of the 26-EMA on the 12-hour chart.
THETA is in price discovery mode
Nonetheless, the digital asset just hit a new all-time high, meaning that investors are still trying to figure out THETA's correct price. It's not easy to find the next resistance level or target price when an asset is trading at all-time highs.
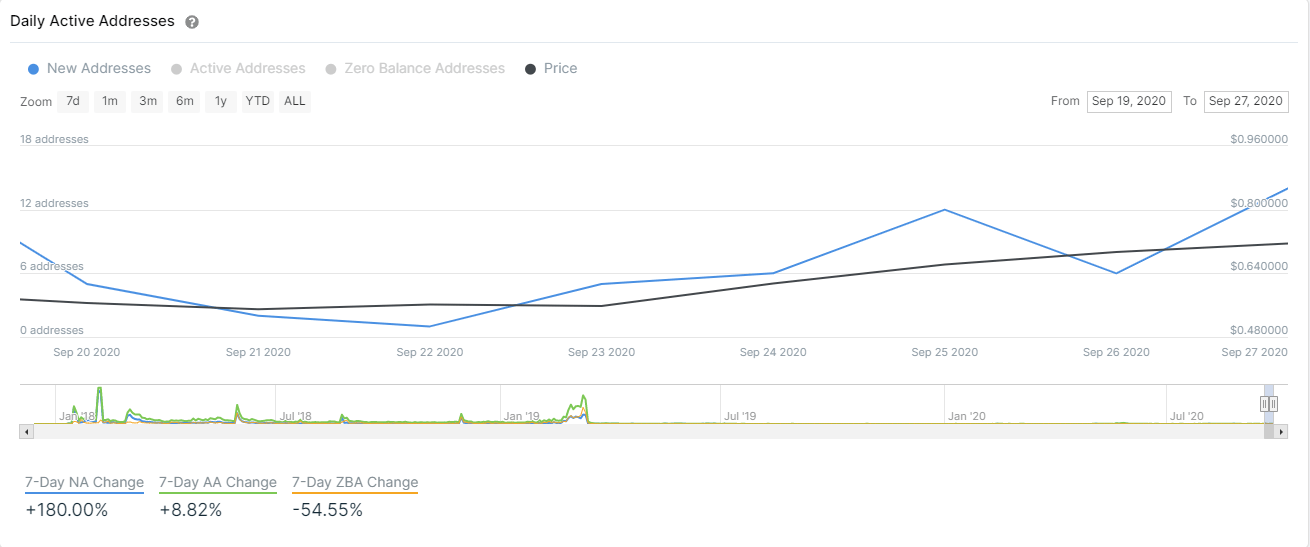
THETA New Addresses Chart
The number of new addresses seems to be going up after a low on September 1. This recent uptrend shows an increase in interest for THETA even though it is hitting all-time highs.
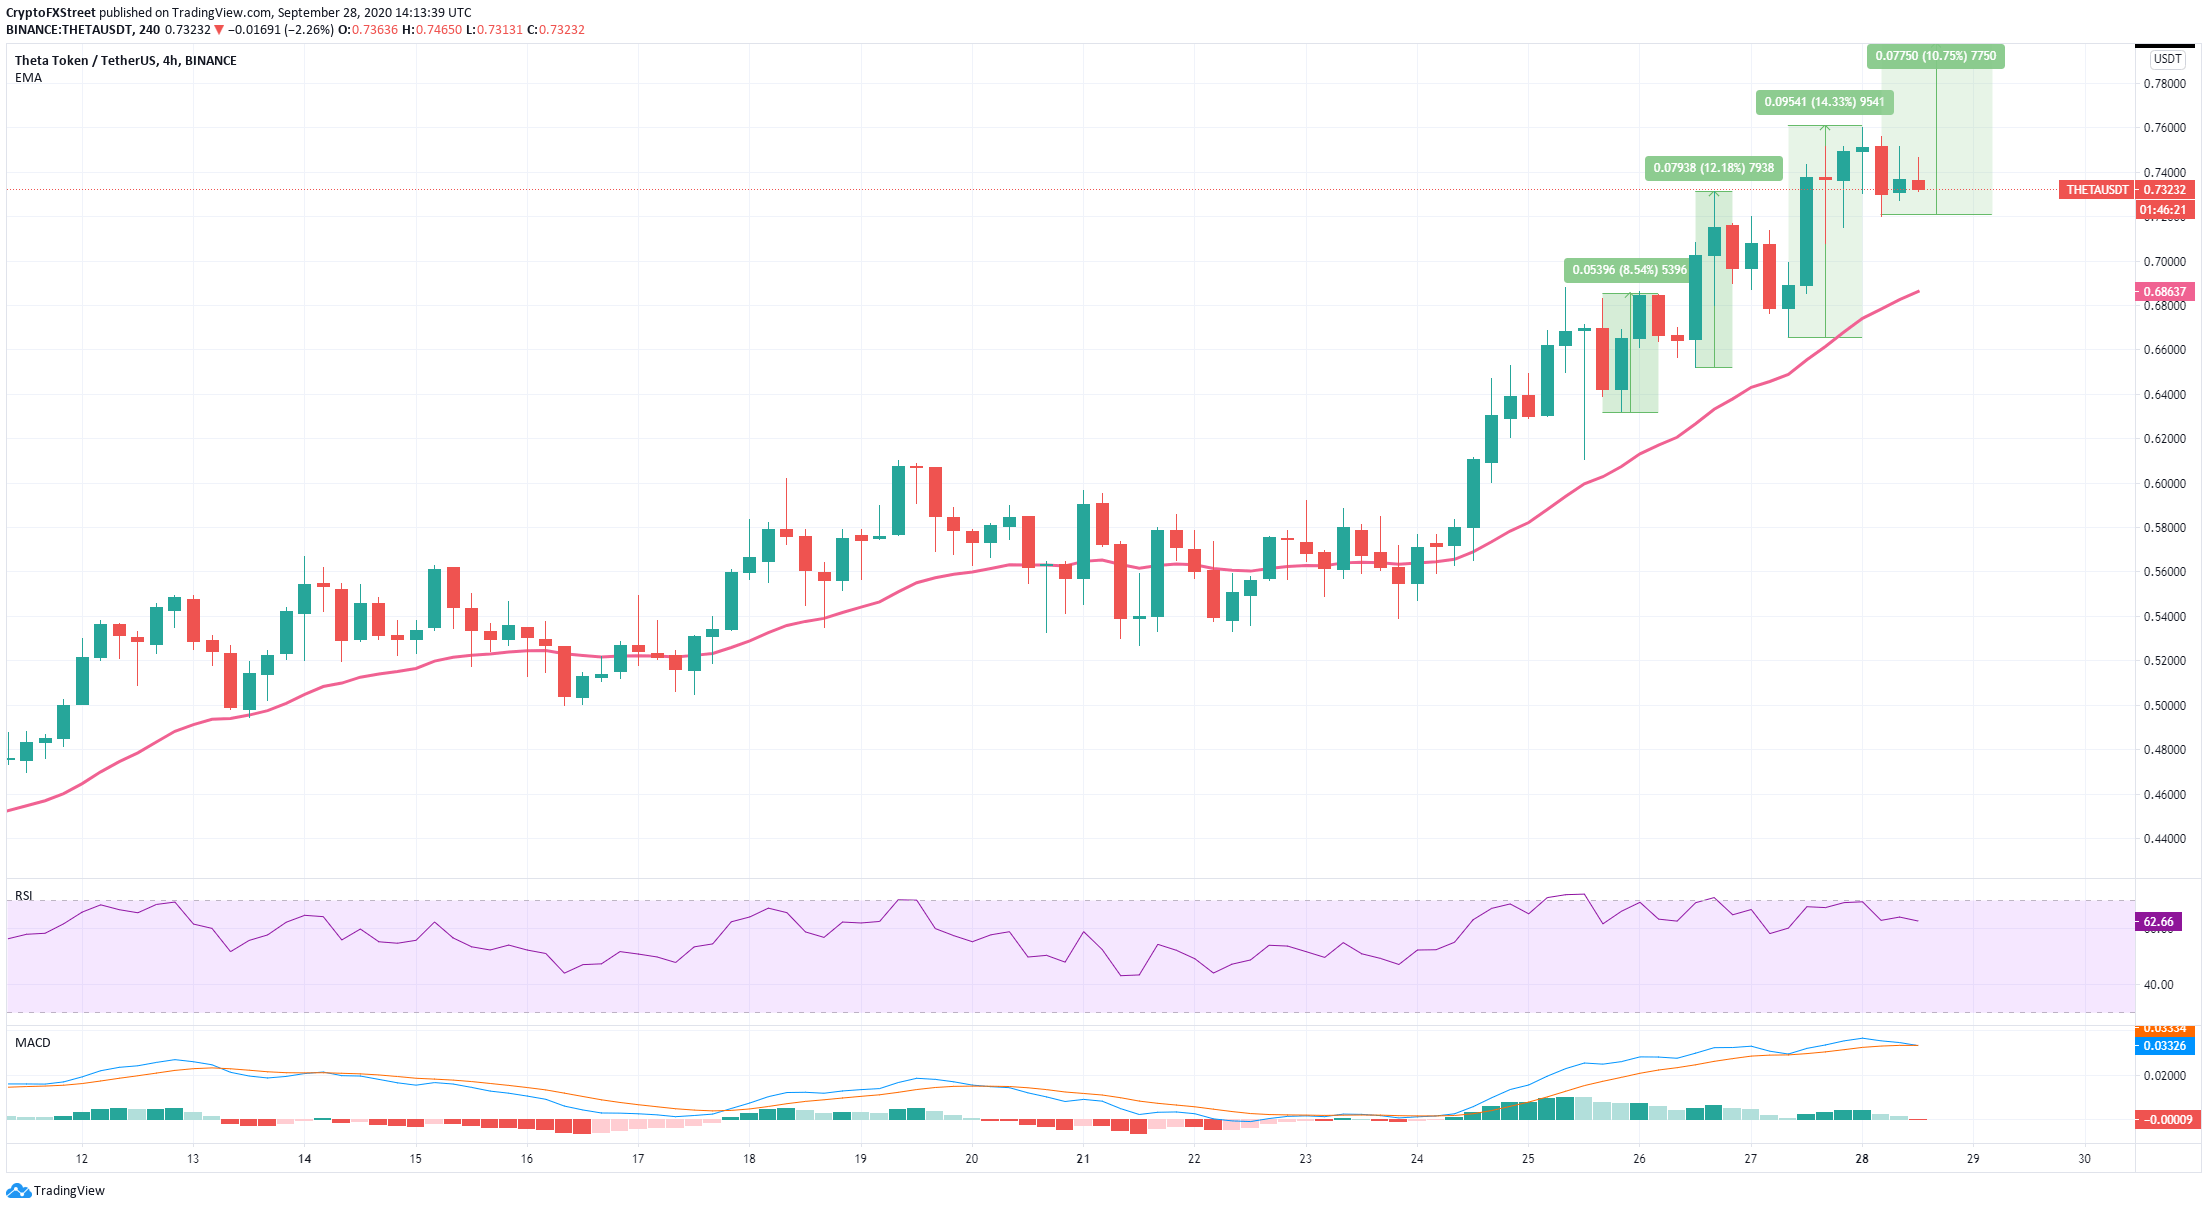
THETA 4-hour chart
In the past three days, each pullback was followed by a new leg up with an average 11% price increase. If this trend continues, another 11% surge will take THETA up to $0.80, a psychological resistance level.
Bullish investors need to keep an eye on the last high at $0.76 as it is the closest resistance level. On the other hand, if the sell signal on the 12-hour chart is validated, we could see THETA trade down to $0.66.
Information on these pages contains forward-looking statements that involve risks and uncertainties. Markets and instruments profiled on this page are for informational purposes only and should not in any way come across as a recommendation to buy or sell in these assets. You should do your own thorough research before making any investment decisions. FXStreet does not in any way guarantee that this information is free from mistakes, errors, or material misstatements. It also does not guarantee that this information is of a timely nature. Investing in Open Markets involves a great deal of risk, including the loss of all or a portion of your investment, as well as emotional distress. All risks, losses and costs associated with investing, including total loss of principal, are your responsibility. The views and opinions expressed in this article are those of the authors and do not necessarily reflect the official policy or position of FXStreet nor its advertisers.