Tezos technicals look solid, suggesting new bull run on the horizon
|- Tezos price is contained inside a 3-day ascending parallel channel.
- Several technical indicators show that Tezos is on the cusp of a new massive bull rally.
Tezos is trading at $2.13 bounded inside an ascending parallel channel on the 3-day chart. Several indicators suggest that XTZ is eying up a potential bull rally targeting $4.49 in the long-term.
Tezos technicals look extremely bullish
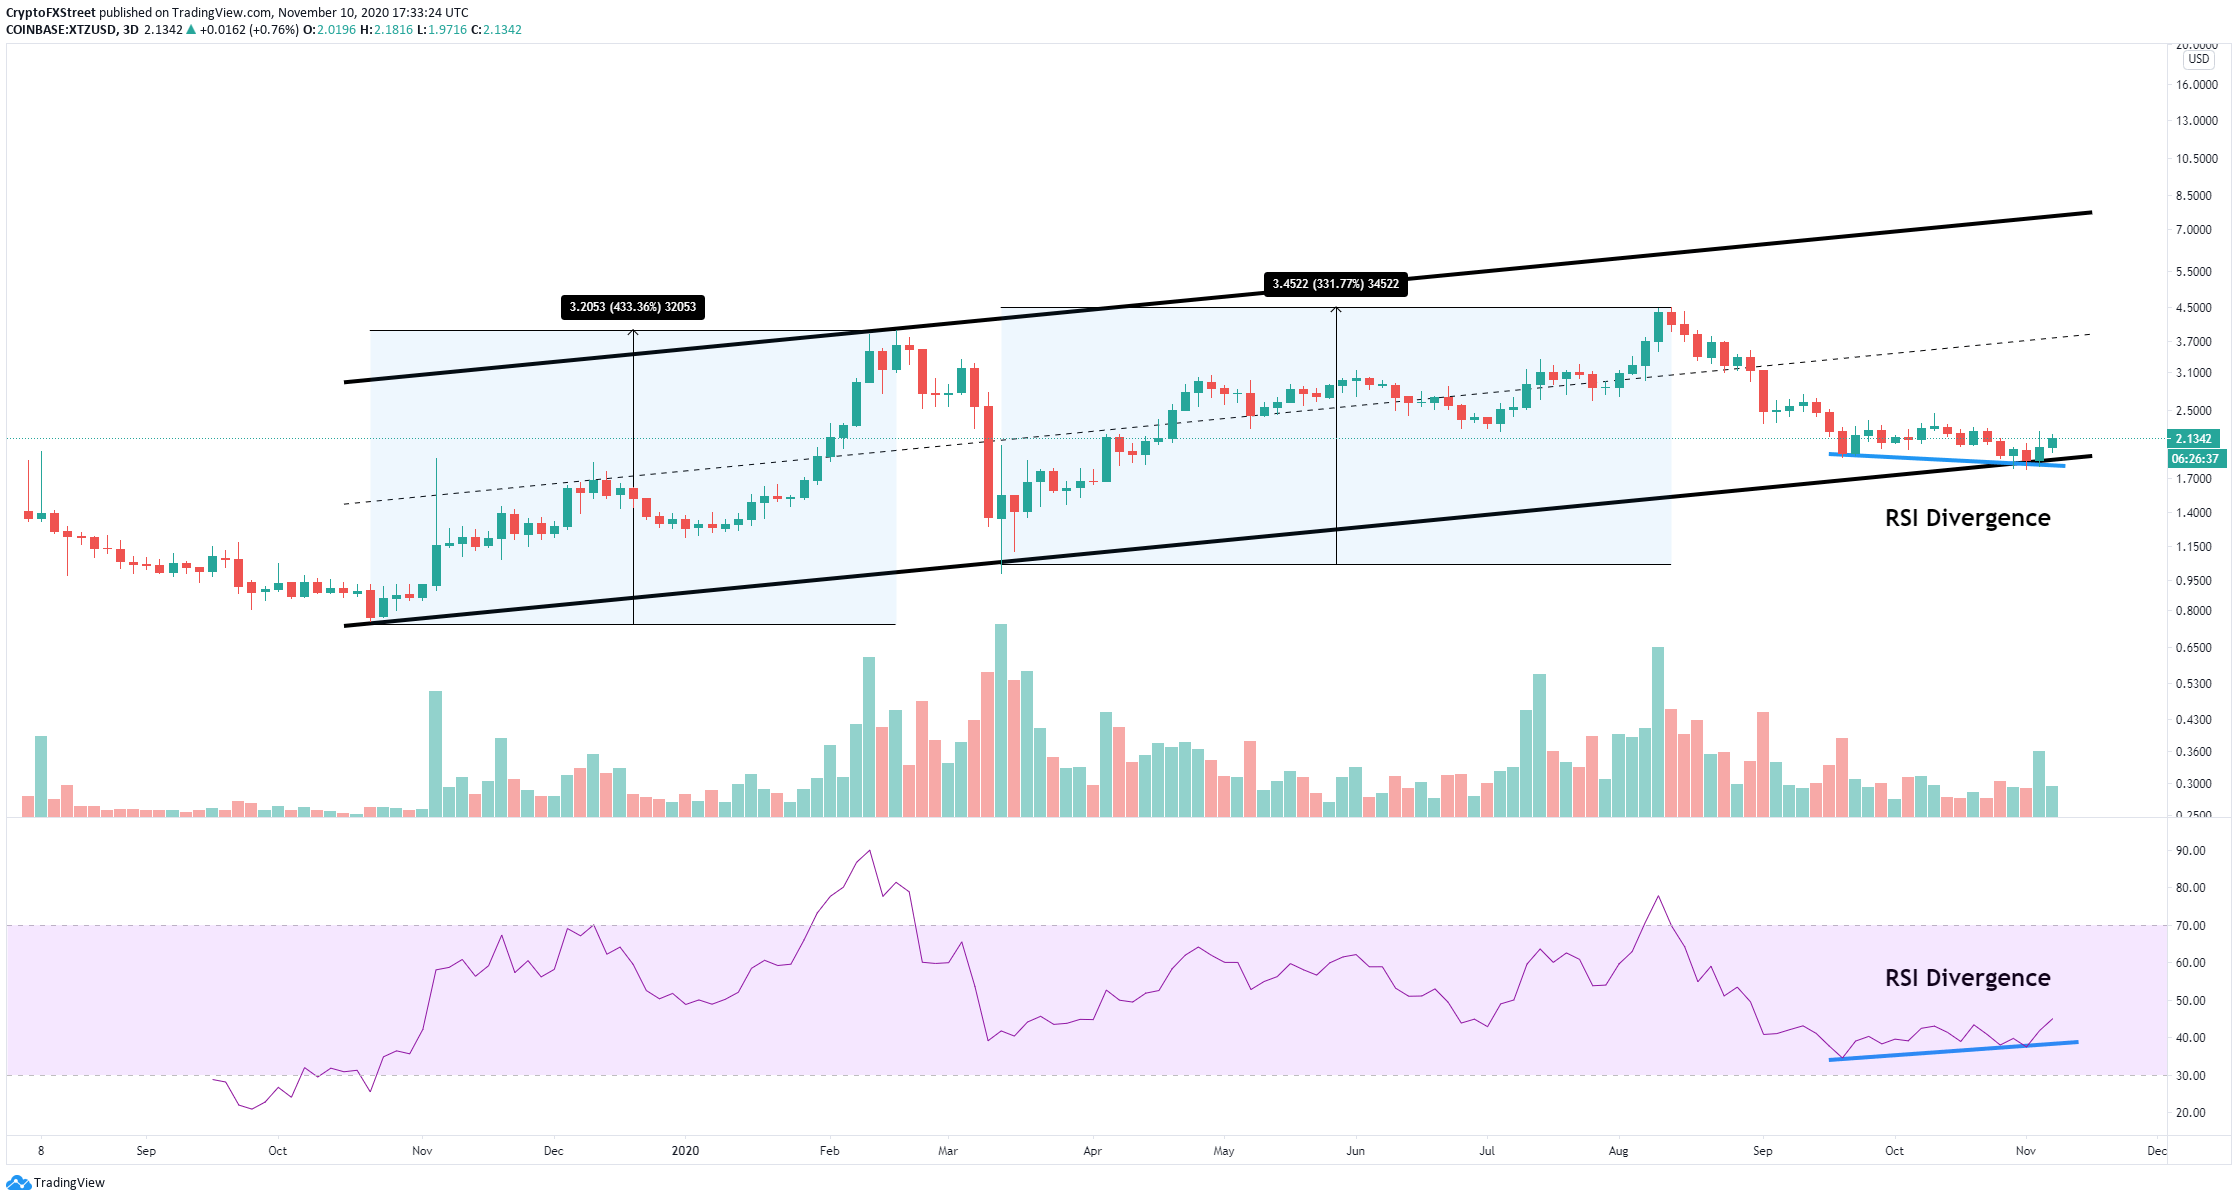
On the 3-day chart, the ascending parallel channel is the most significant pattern to watch for. It seems that Tezos price is rebounding from the lower boundary at $1.86 which has been a significantly bullish indicator in the past.
XTZ/USD 3-day chart
The past touch on March 13, led Tezos price towards a 353% rally within the next few months. Similarly, the test of the boundary in October 2019, was followed by a 425% price explosion until February 2020. Additionally, there is a bullish divergence forming between the price and the RSI which also adds further buying pressure.
XTZ/USD 3-day chart
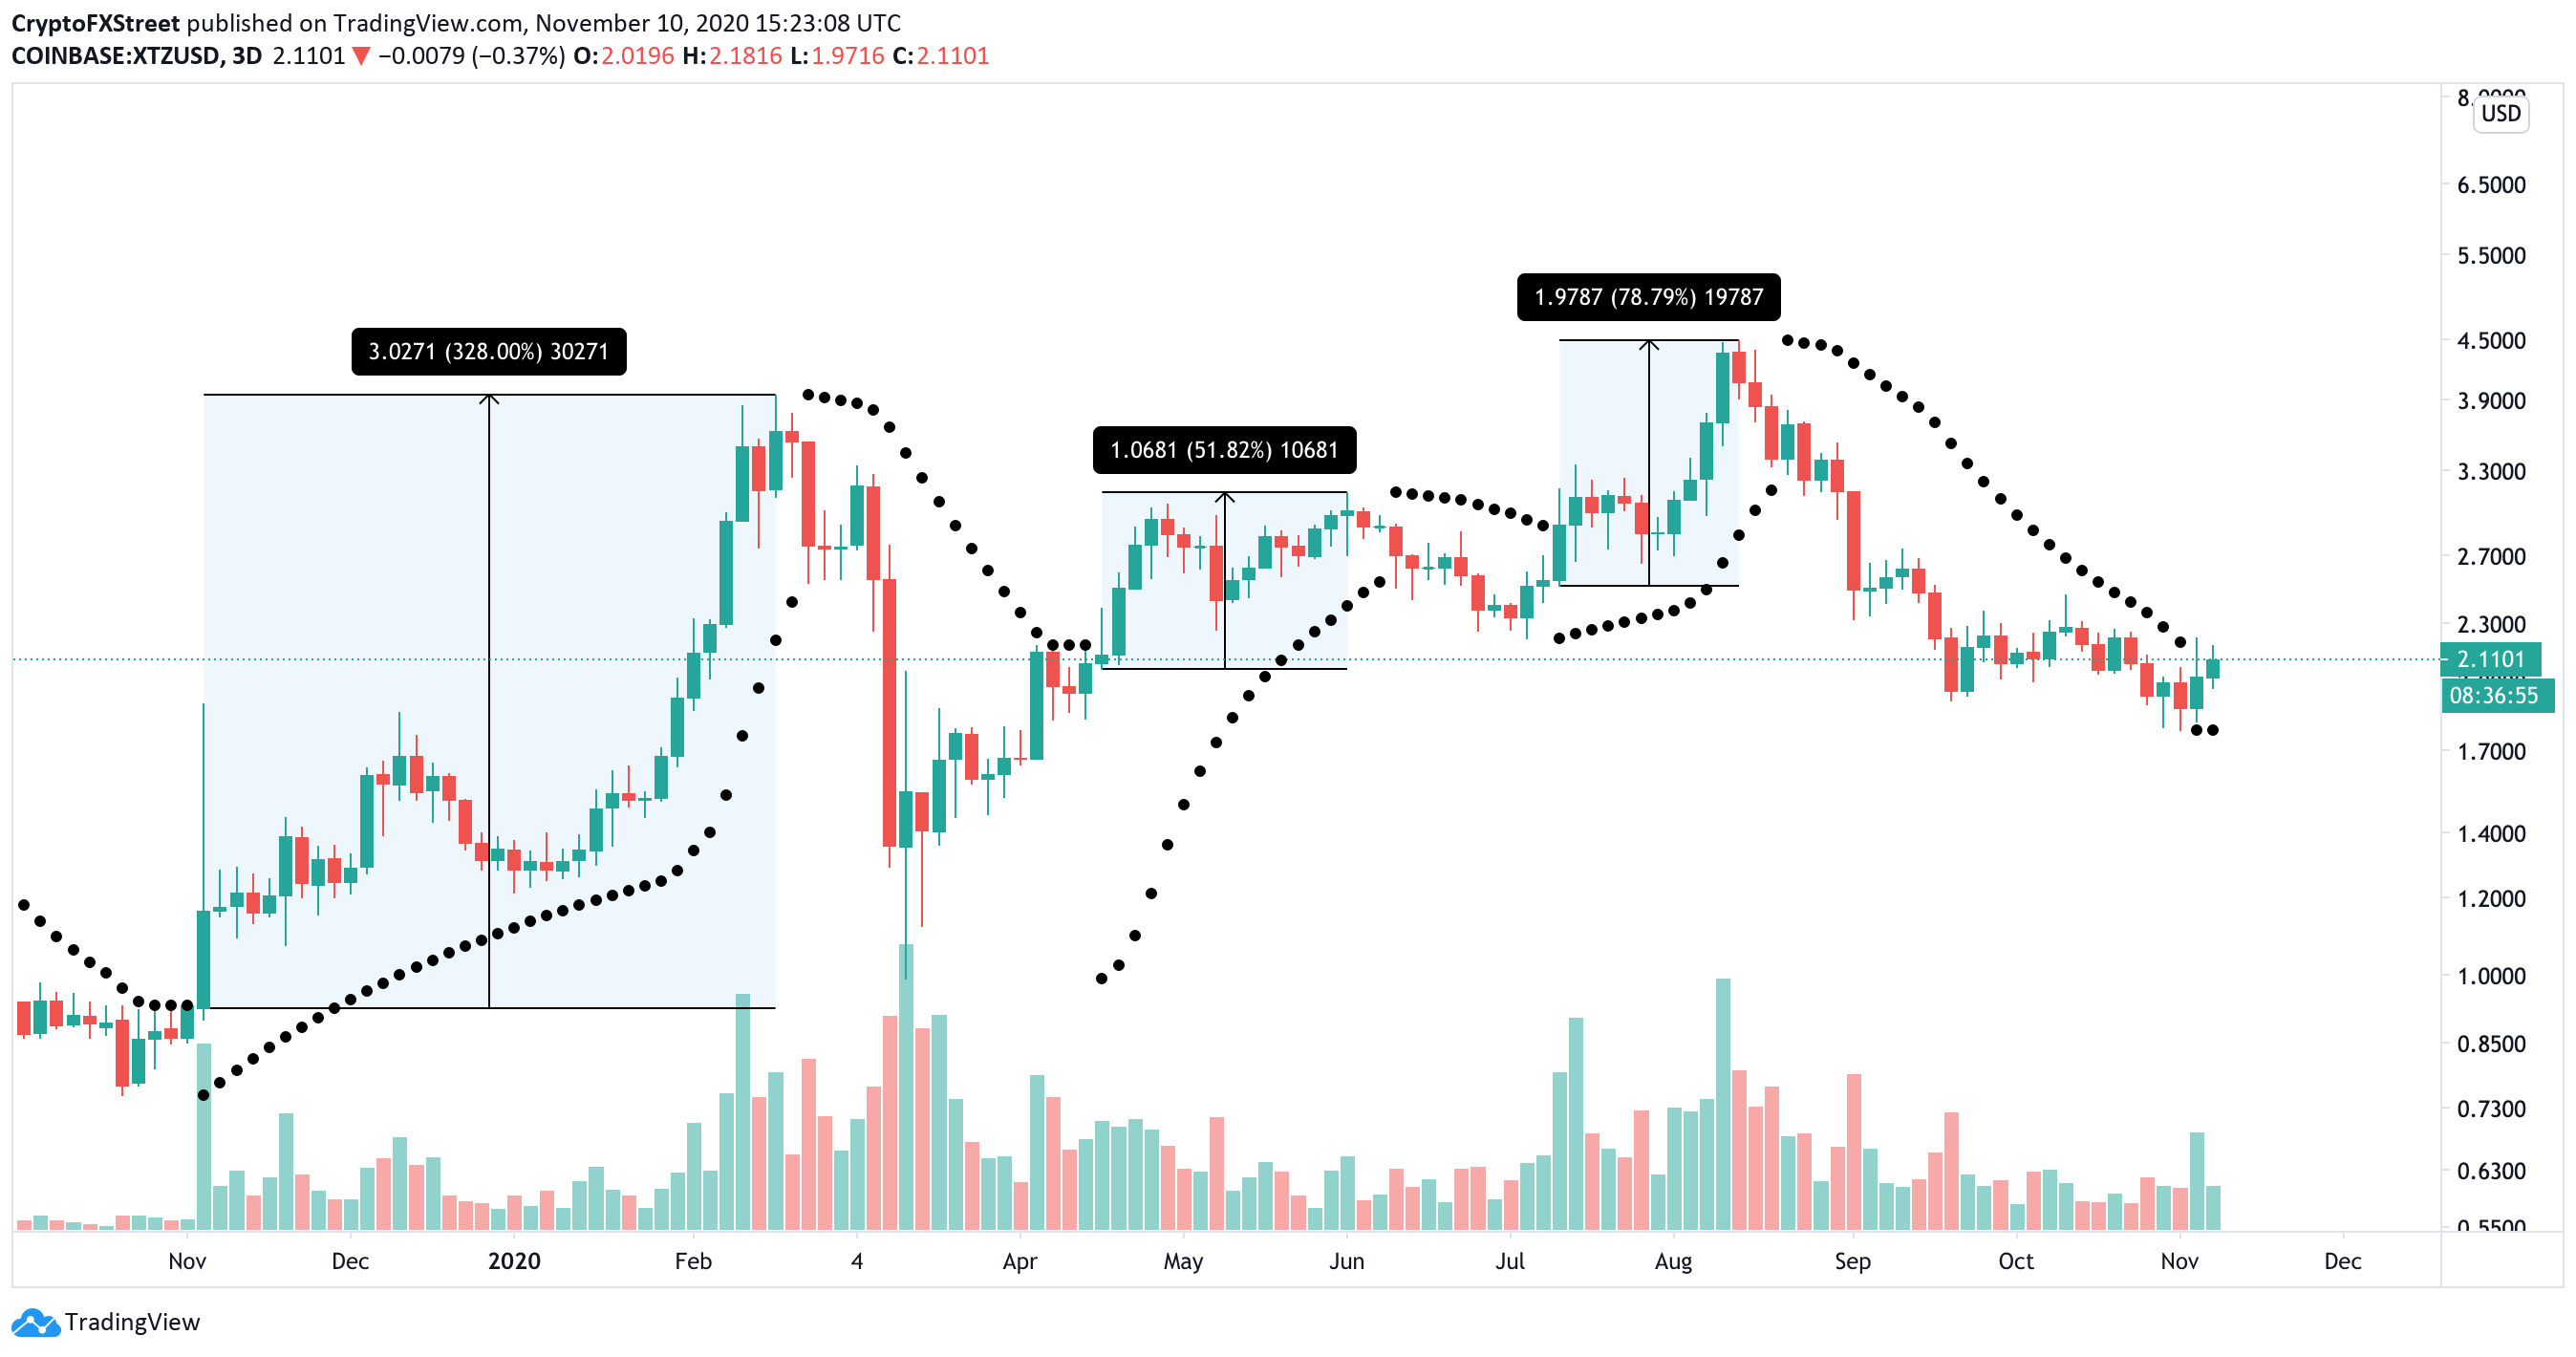
This theory can be further sustained using the Lucid SAR indicator. Every time the SAR points turned bullish, Tezos price reacted positively since November 2019. They have turned bullish again for the first time since July 2020.
-637406268782148285.png)
XTZ/USD 3-day Fibonacci retracement chart
Using the Fibonacci retracement index, we observe that $2.75 is the first short-term price target, followed by $3.15, the 0.382 Fib retracement level, and $3.66, the 0.236 Fib. The highest price point would be $4.49.
However, if Tezos price closes below the 0.786 Fib level at $1.73, the bullish outlook would be invalidated most likely driving XTZ towards the next level at $0.989 as there are no other significant support levels on the way down.
Information on these pages contains forward-looking statements that involve risks and uncertainties. Markets and instruments profiled on this page are for informational purposes only and should not in any way come across as a recommendation to buy or sell in these assets. You should do your own thorough research before making any investment decisions. FXStreet does not in any way guarantee that this information is free from mistakes, errors, or material misstatements. It also does not guarantee that this information is of a timely nature. Investing in Open Markets involves a great deal of risk, including the loss of all or a portion of your investment, as well as emotional distress. All risks, losses and costs associated with investing, including total loss of principal, are your responsibility. The views and opinions expressed in this article are those of the authors and do not necessarily reflect the official policy or position of FXStreet nor its advertisers.