Polkadot Price Prediction: DOT is at risk of falling 50% if critical support breaks
|- DOT is currently trading at $4.04 right at the top of an important trendline on the daily chart.
- Rejection from this level into a breakout of the crucial support below can send DOT into a 50% correction.
Polkadot has been trading fairly sideways for the past month after reaching a massive market capitalization of $5.16 billion right after it started trading on September 3. Nonetheless, the digital currency is still ranked 8th at a $3.45 billion market cap.
Can DOT defend this significant support level to avoid slipping further?
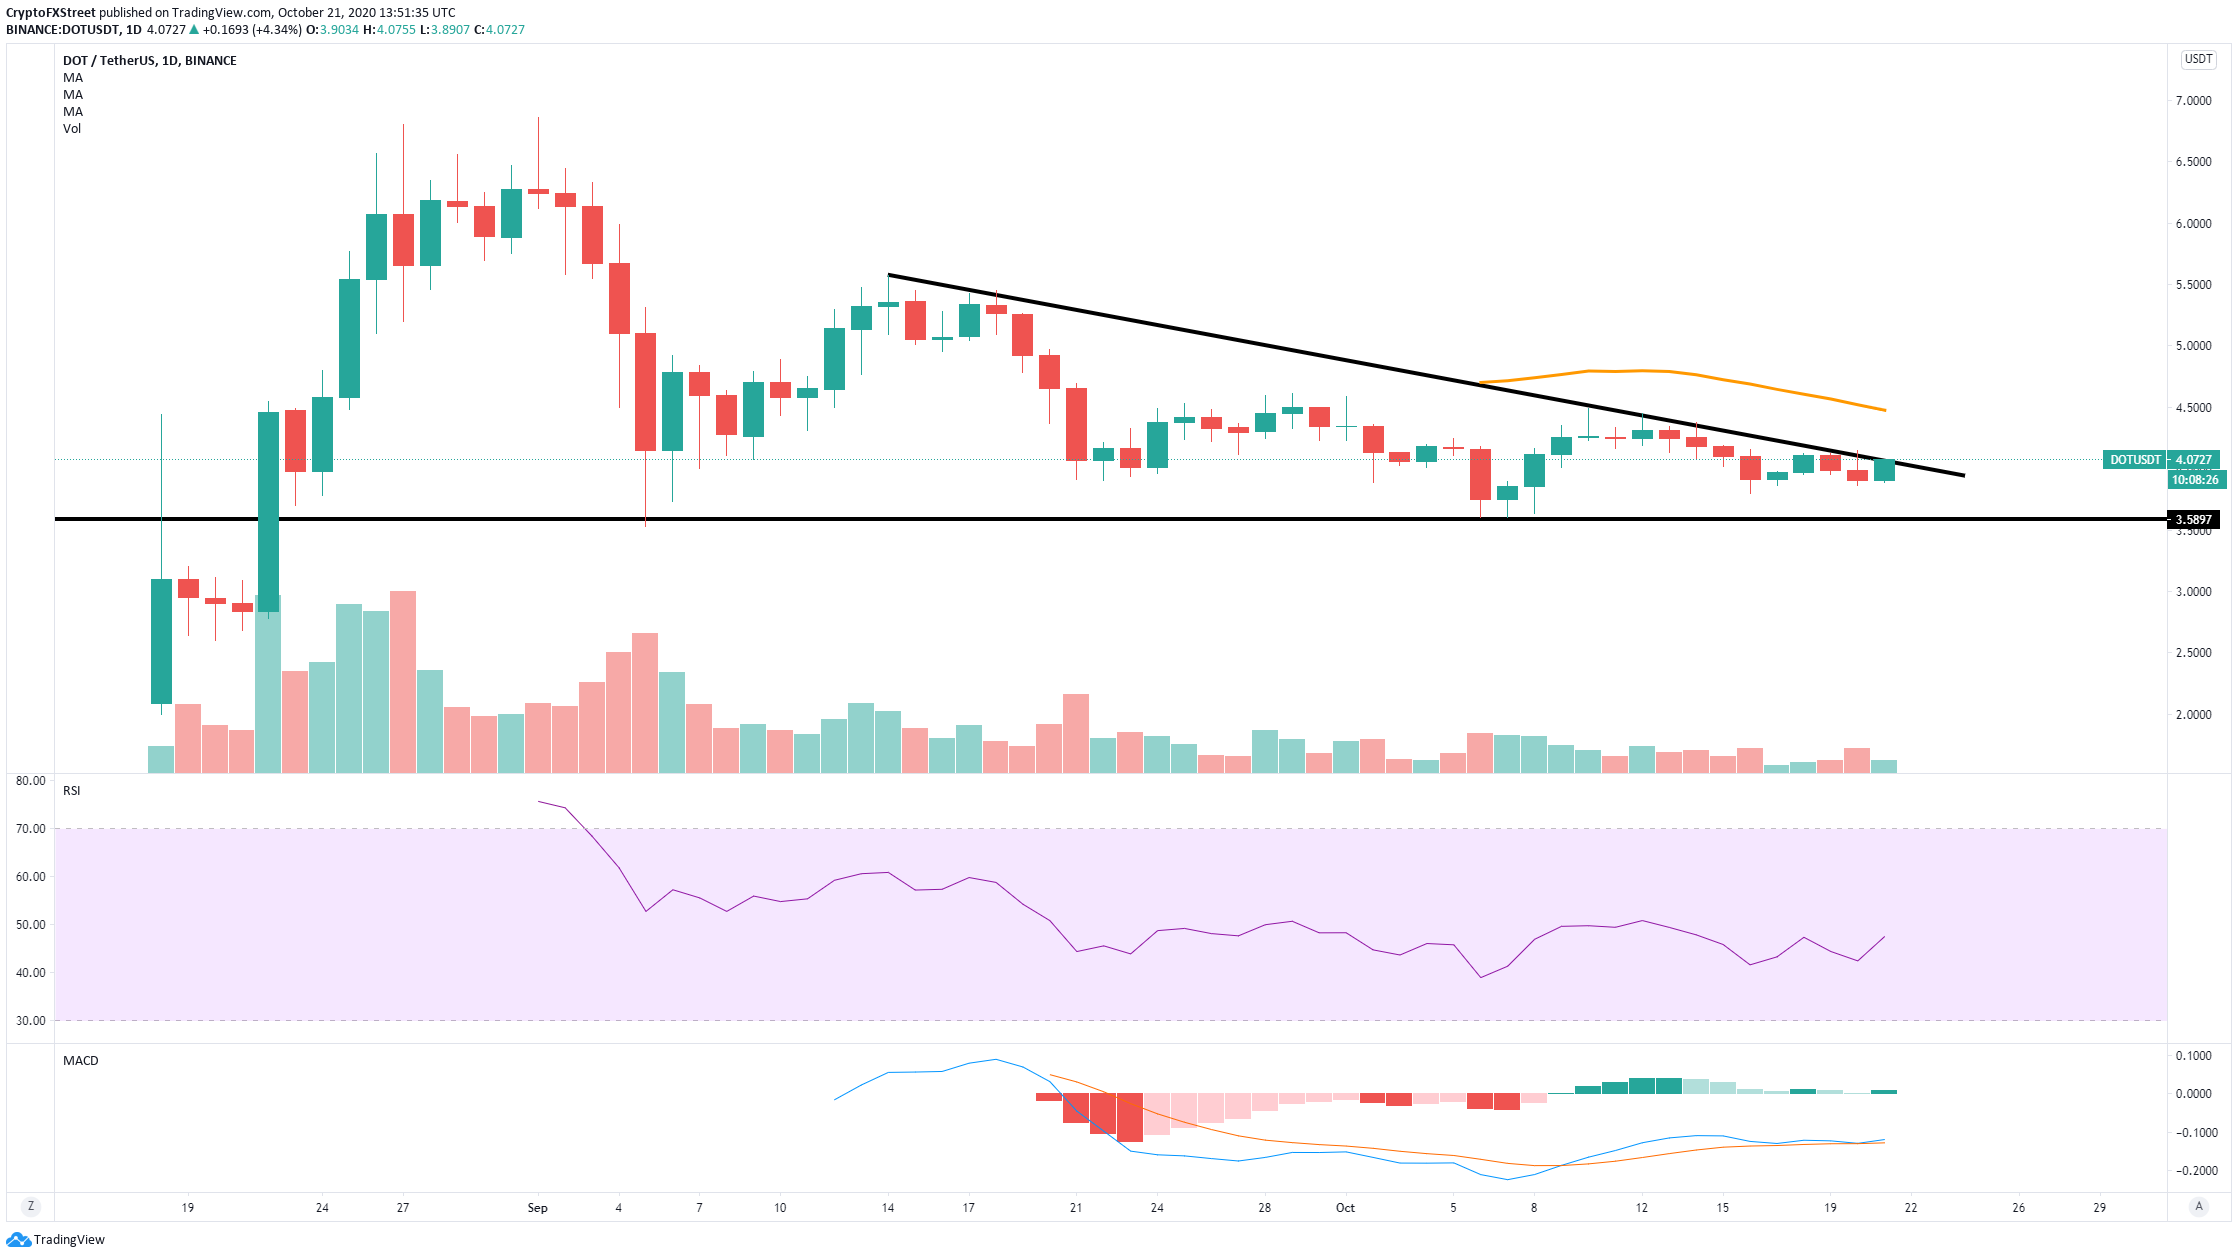
Polkadot has established what seems to be a descending triangle on the daily chart. The upper boundary of this pattern has rejected the price of DOT several times in the past on September 18, October 10, and on five more occasions since then.
DOT/USDT daily chart
The price is currently right at the upper boundary of the pattern again. Another rejection can easily drive the price towards the support at $3.58, but most importantly, a breakout below this point can send DOT into a 50% correction down to $1.8.
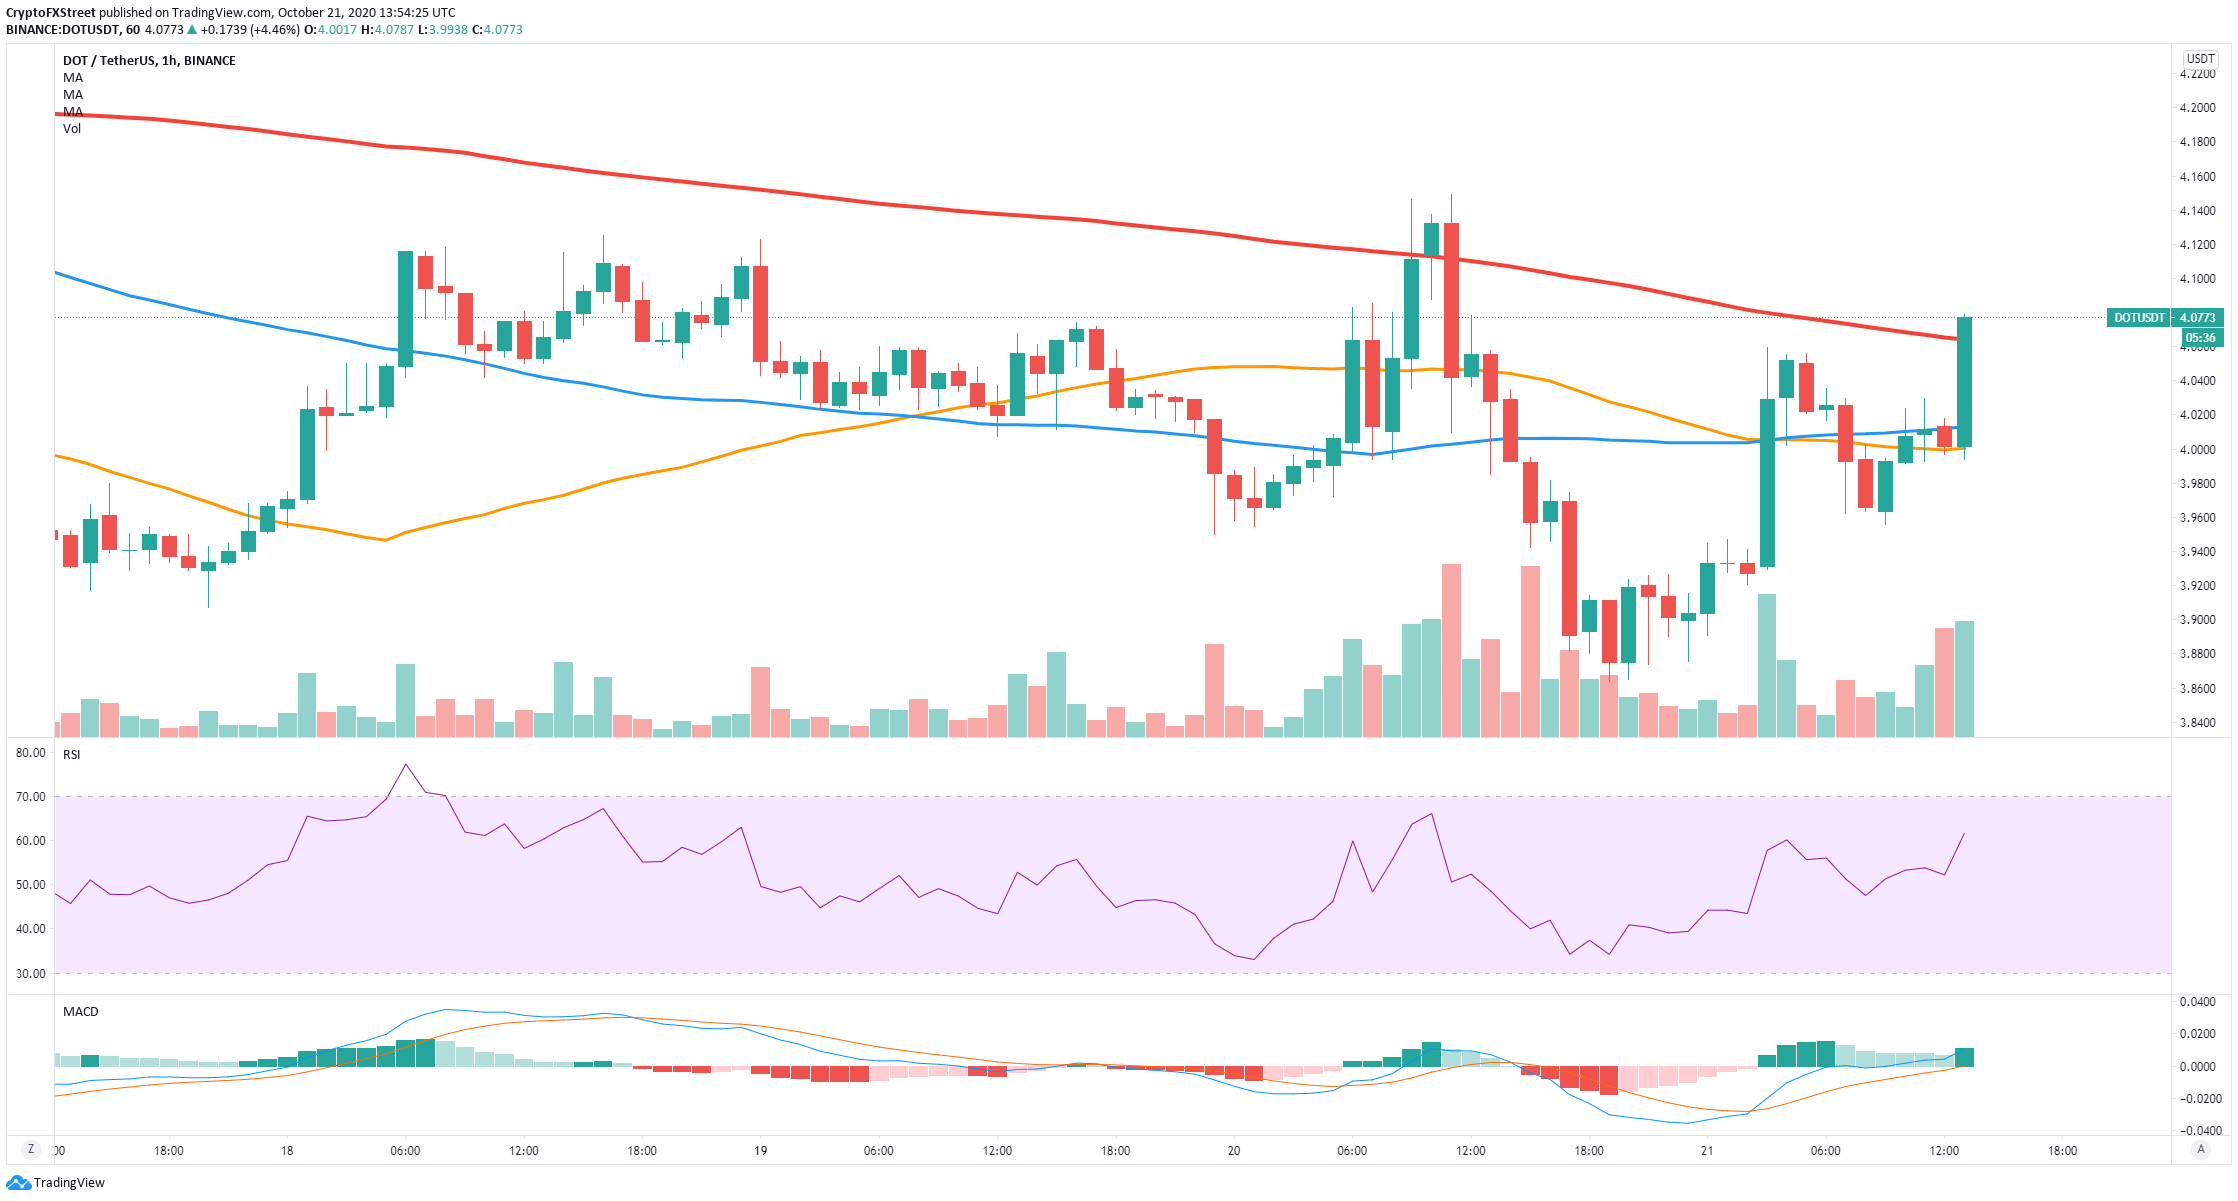
DOT/USDT 1-hour chart
Despite the pessimistic outlook on the daily chart, the hourly chart has flipped in favor of the bulls after the price climbed above the 50-SMA and the 100-SMA, and more recently the 200-SMA. The MACD also turned bullish around 12 hours ago and it’s gaining strength.
The confirmed hourly uptrend after several higher lows and higher highs gives buyers a lot of strength in the short-term. Of course, a bullish breakout from the daily descending triangle pattern will have the same consequences but to the upside towards $4.5.
Polkadot critical price points
The descending triangle formed on the daily chart is by far the most important pattern to keep in mind. A bearish breakout below the support level at $3.58 can easily drive the price of DOT down to $1.8, approximately a 50% pullback.
On the other hand, bulls are taking control over the short-term timeframes. Similarly, a breakout above the upper trendline of the triangle pattern can push DOT towards a high of $4.5, where the 50-SMA on the daily chart is established currently.
Information on these pages contains forward-looking statements that involve risks and uncertainties. Markets and instruments profiled on this page are for informational purposes only and should not in any way come across as a recommendation to buy or sell in these assets. You should do your own thorough research before making any investment decisions. FXStreet does not in any way guarantee that this information is free from mistakes, errors, or material misstatements. It also does not guarantee that this information is of a timely nature. Investing in Open Markets involves a great deal of risk, including the loss of all or a portion of your investment, as well as emotional distress. All risks, losses and costs associated with investing, including total loss of principal, are your responsibility. The views and opinions expressed in this article are those of the authors and do not necessarily reflect the official policy or position of FXStreet nor its advertisers.