Litecoin price prepares for a multi-month breakout despite on-going correction
|- Litecoin price is at $55.88 after a notable dip towards $53.44.
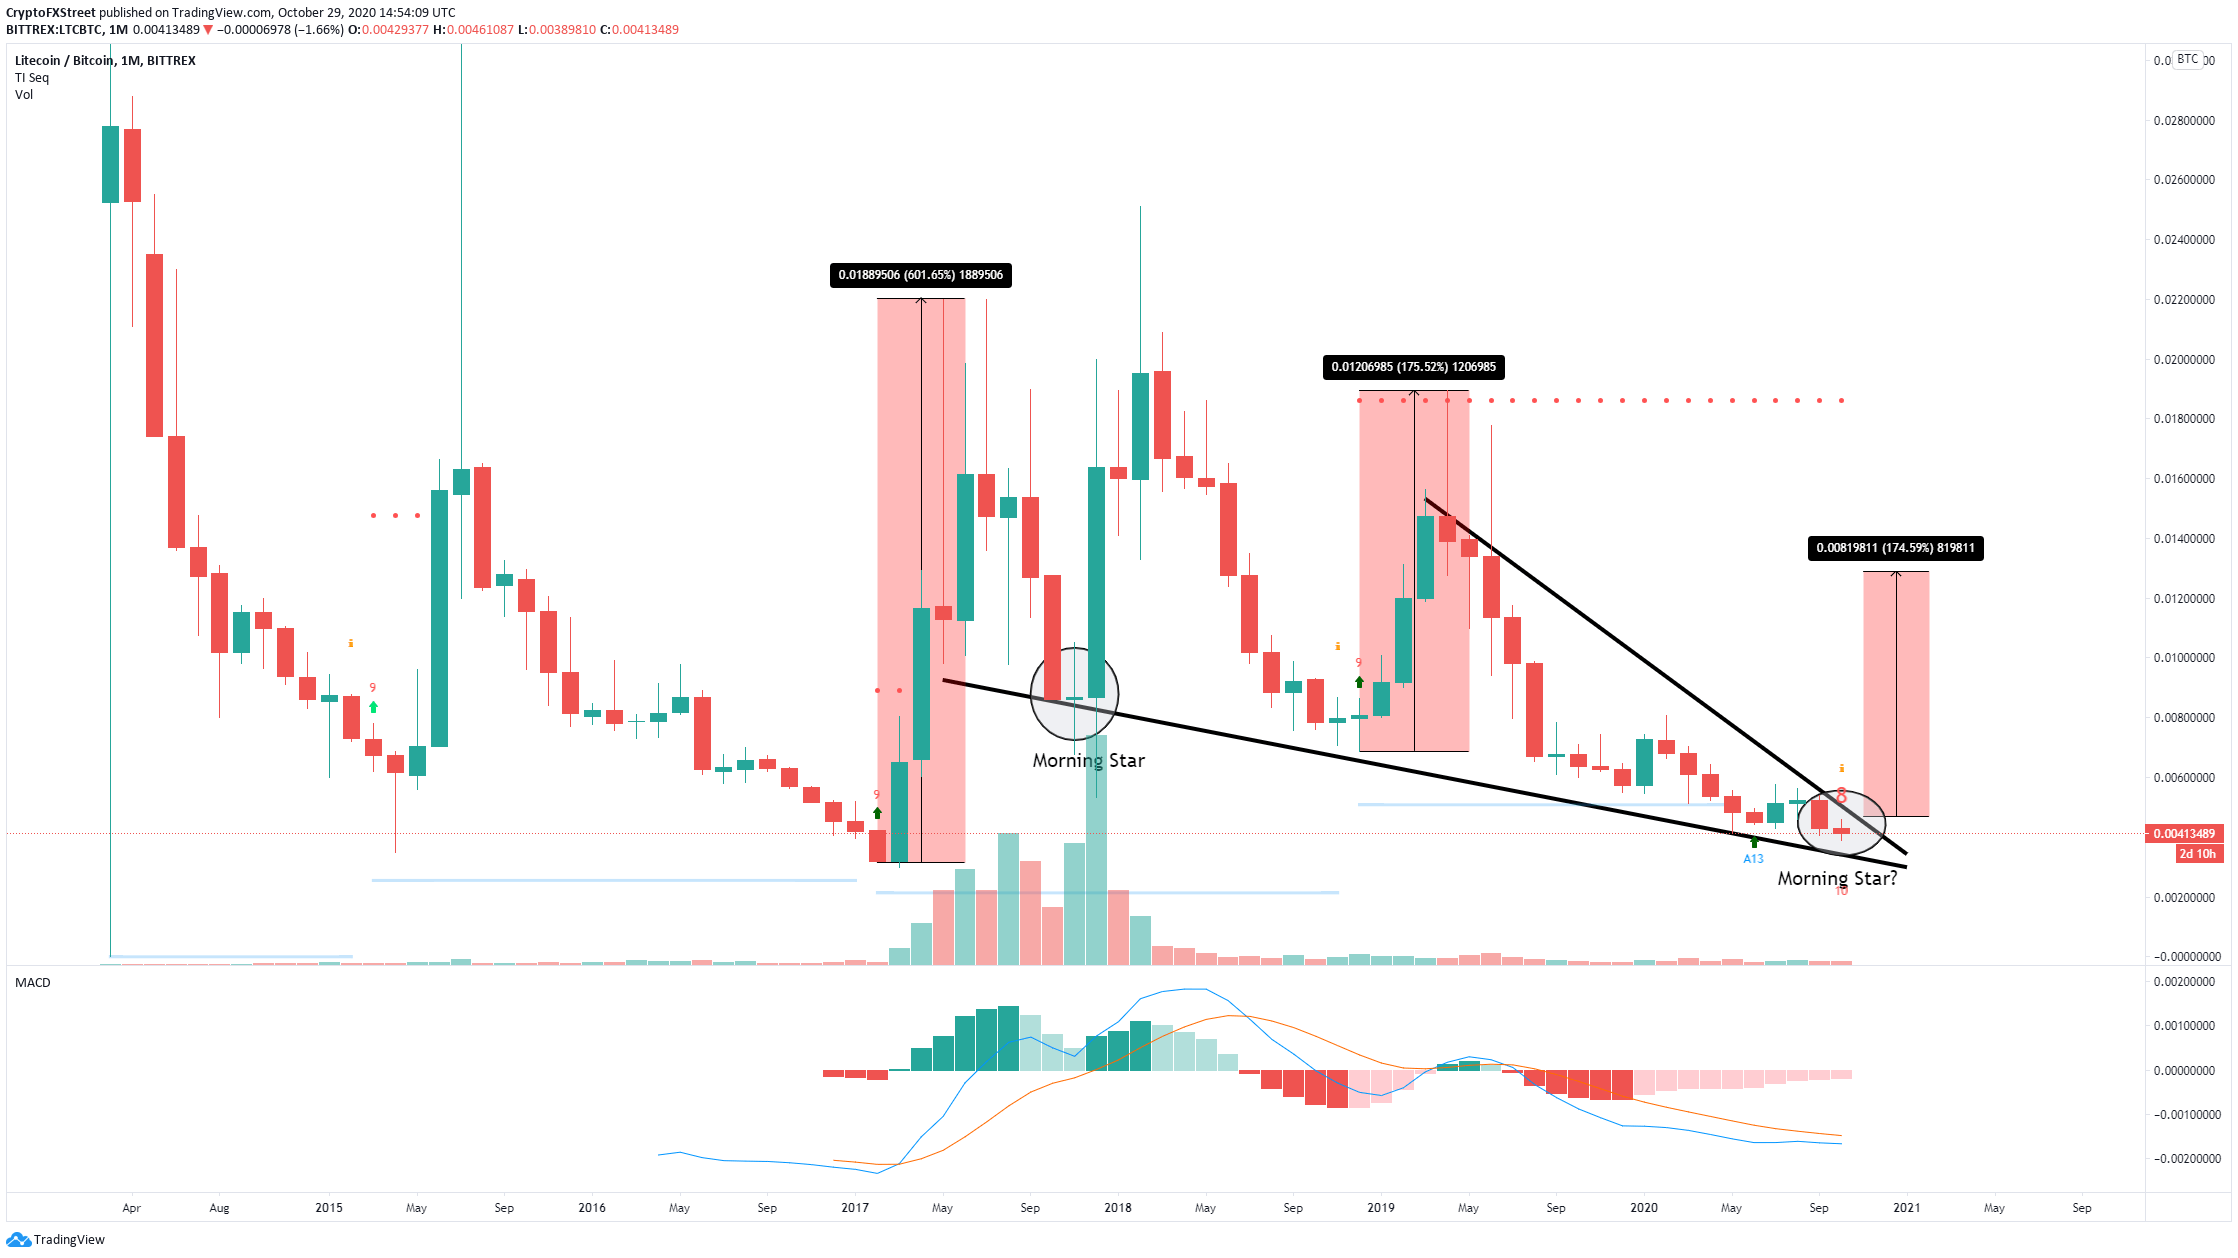
- The LTC/BTC chart shows a descending wedge pattern that is on the verge of a breakout.
LTC seems to be trading inside a descending wedge formed on the monthly chart and is currently at $55.88, after having touched $53.44. The pattern is on the cusp of a massive breakout. Additionally, an essential technical indicator is about to present a strong buy signal.
Litecoin price prediction: The technical picture
One of the most important charts for Litecoin in the long-term is the monthly LTC/BTC chart. The descending wedge that formed here is on the verge of a breakout, and the TD Sequential indicator presents a red eight candle signal, which often precedes a strong buy signal.
LTC/BTC monthly chart
When looking at the past two instances when the TD Sequential indicator flashed buy signals in the 1-month chart, Litecoin's price went through significant bull rallies. The first major price explosion took place in February 2017, when LTC jumped 600% against BTC within five months after the TD setup turned bullish. A similar price action was seen around December 2018 as the LTC/BTC trading pair surged over 175% within five months.
Moreover, it seems that the MACD is slowly turning bullish for the first time since April 2019. If all of these positive signals are validated, Litecoin would have a price target of 1.28 million satoshis or around $154.
It is worth mentioning that LTC also appears to be forming a morning star pattern like the one we saw in November 2017. This is a notable sign of a reversal, especially when combined with the TD Sequential indicator.
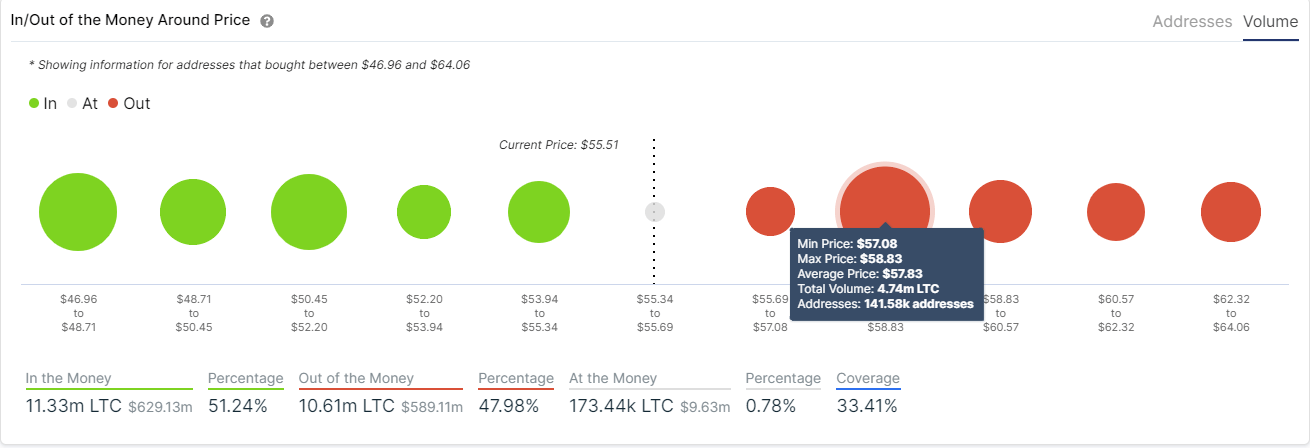
LTC IOMAP chart
While the long-term price action for the LTC/BTC trading pair is quite optimistic, IntoTheBlock's In/Out of the Money Around Price (IOMAP) model shows a robust resistance ahead of the LTC/USD trading pair. Roughly 141,500 addresses are holding over 4.7 million LTC between $57 and $59. Such a massive supply barrier must be turned into support to add credence to the bullish outlook.
Information on these pages contains forward-looking statements that involve risks and uncertainties. Markets and instruments profiled on this page are for informational purposes only and should not in any way come across as a recommendation to buy or sell in these assets. You should do your own thorough research before making any investment decisions. FXStreet does not in any way guarantee that this information is free from mistakes, errors, or material misstatements. It also does not guarantee that this information is of a timely nature. Investing in Open Markets involves a great deal of risk, including the loss of all or a portion of your investment, as well as emotional distress. All risks, losses and costs associated with investing, including total loss of principal, are your responsibility. The views and opinions expressed in this article are those of the authors and do not necessarily reflect the official policy or position of FXStreet nor its advertisers.