Ethereum technical analysis: Looking for support levels
|- As all the major cryptocurrencies take a battering today ETH/USD is down 5.6%.
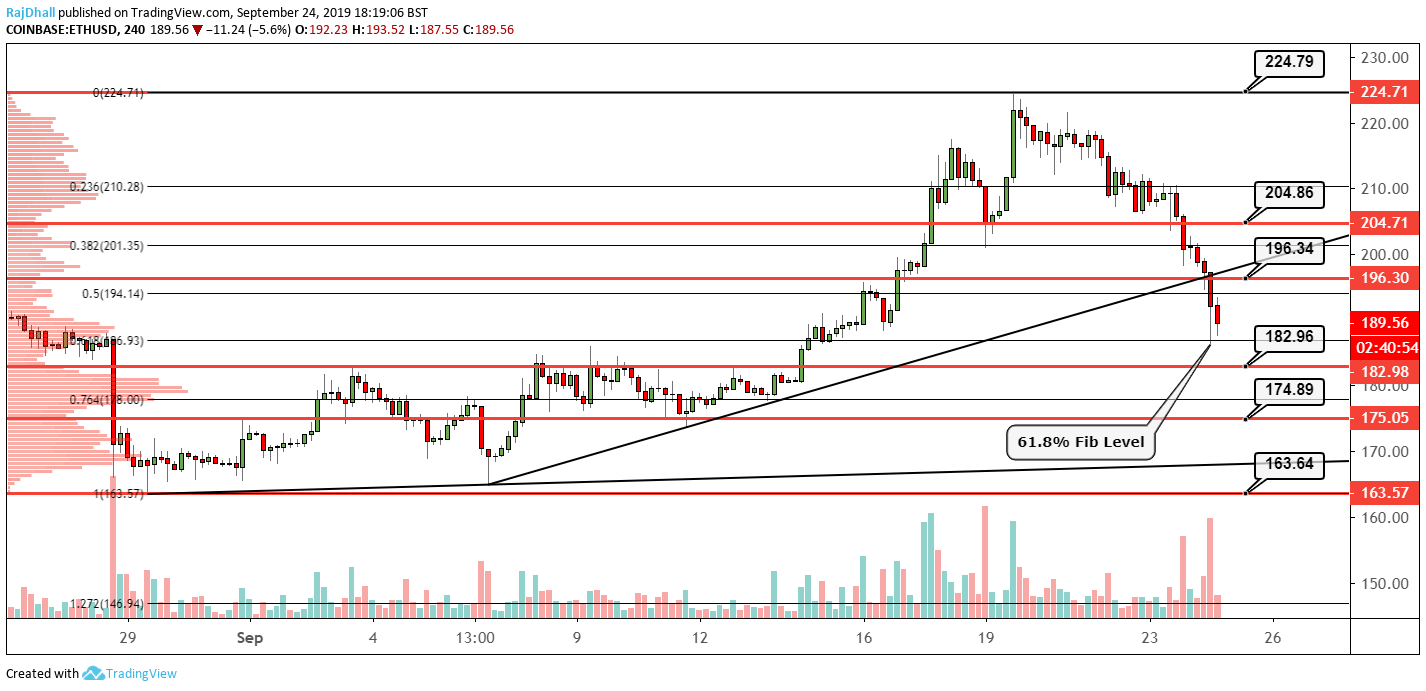
- Volume is heavily backing the sell-side and there could be some support coming up.
On the four hour chart below ETH/USD is currently in freefall.
Looking at the chert the golden Fibonacci ratio of 61.8% is providing some support and price has stalled.
The main support level that is next up on the chart is at 182.96.
On the volume profile, this price is a low volume node which means there is normally not much volume interest there and the level was used as resistance a few times on the left-hand side of the chart.
Elsewhere 163.64 is the main low and if this breaks it would mean on the higher timeframes the downtrend has resumed once again.
This is quite a heavy retracement after the trend changed recently and if we get a move back up the 200.00 psychological level may act as resistance.
Information on these pages contains forward-looking statements that involve risks and uncertainties. Markets and instruments profiled on this page are for informational purposes only and should not in any way come across as a recommendation to buy or sell in these assets. You should do your own thorough research before making any investment decisions. FXStreet does not in any way guarantee that this information is free from mistakes, errors, or material misstatements. It also does not guarantee that this information is of a timely nature. Investing in Open Markets involves a great deal of risk, including the loss of all or a portion of your investment, as well as emotional distress. All risks, losses and costs associated with investing, including total loss of principal, are your responsibility. The views and opinions expressed in this article are those of the authors and do not necessarily reflect the official policy or position of FXStreet nor its advertisers.