Ethereum Price Prediction: ETH needs to defend this critical support level
|- Ethereum is currently trading at $344 right at a crucial support level.
- Earlier, the price fell below the 100-SMA on the daily chart but has recovered.
Ethereum is trading at $344 and having trouble staying above the 100-SMA on the daily chart. Several indicators are showing an increase in selling pressure.
Ethereum could slide towards $300
The digital asset is at risk of falling below an important support level at $343. The 100-SMA on the daily chart has acted as a strong support point several times in the past and hasn’t been notably cracked since March 2020.
ETH/USD daily chart
A bearish breakout below the 100-SMA has the potential to drop ETH to $300. The nearest support level would be $320, a low established on September 23; however, considering the importance of the moving average, Ethereum is more likely to slip towards $300 into the 200-SMA at $270 as the lowest price target.
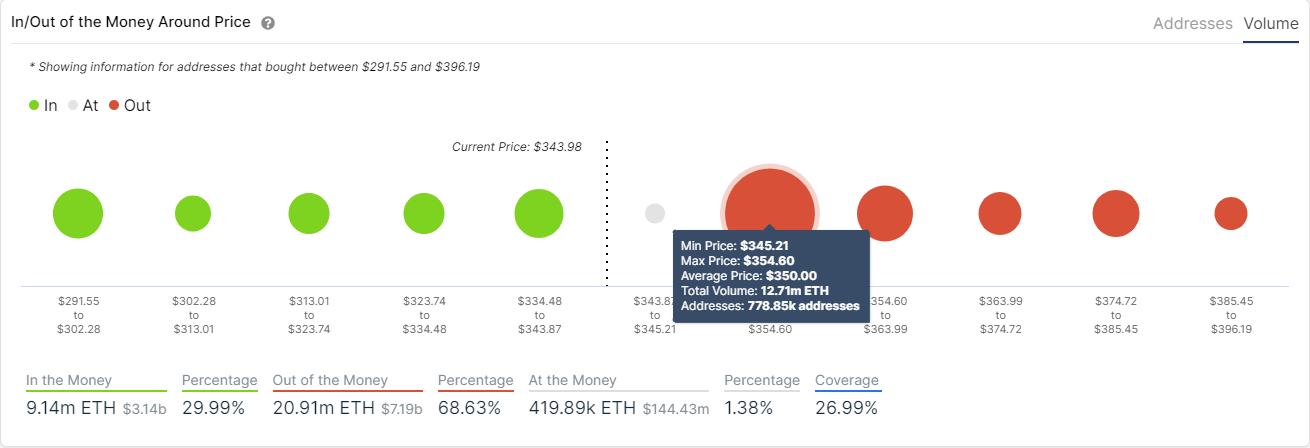
ETH IOMAP Chart
The In/Out of the Money Around Price chart by IntoTheBlock seems to be supporting this theory, showing steep resistance ahead but very little support below. The range between $345 and $354 is the strongest with a total volume of 12.7 million ETH. On the way down, below $343 and until $291, there is only 9 million ETH in volume, significantly lower between a much broader price range.
ETH/USD 4-hour chart
-637377607271246577.png)
On the 4-hour chart, bulls are starting to turn things in their favor after establishing a higher low at $334 compared to $332.8, and they are on the way to confirm an uptrend. The MACD is also on the verge of turning bullish, which usually indicates the price can climb higher.
The most important resistance point is $348, where both the 50-SMA and the 100-SMA converge. A bullish breakout above this point can take Ethereum up to $357 at the 200-SMA.
Investors need to look out for the daily 100-SMA, as it is the most critical indicator in the short-term. A successful defense of this SMA can help Ethereum rise to $357.
On the other hand, a clear breakout below the 100-SMA has the potential to drop ETH down to $300 and perhaps even $270 where the 200-SMA is located on the daily chart.
Information on these pages contains forward-looking statements that involve risks and uncertainties. Markets and instruments profiled on this page are for informational purposes only and should not in any way come across as a recommendation to buy or sell in these assets. You should do your own thorough research before making any investment decisions. FXStreet does not in any way guarantee that this information is free from mistakes, errors, or material misstatements. It also does not guarantee that this information is of a timely nature. Investing in Open Markets involves a great deal of risk, including the loss of all or a portion of your investment, as well as emotional distress. All risks, losses and costs associated with investing, including total loss of principal, are your responsibility. The views and opinions expressed in this article are those of the authors and do not necessarily reflect the official policy or position of FXStreet nor its advertisers.