Bitcoin may drop before the US elections and rebound sharply afterwards, historical data shows
|- The upcoming 2020 US election will have a direct impact on the cryptocurrency market.
- Although no candidate has presented policies in favor or against cryptos, result will still influence Bitcoin and the entire market.
The entire global stock market is already starting to experience volatility due to the upcoming US presidential election. In the past, the cryptocurrency market had somewhat similar reactions.
Will history repeat itself with the 2020 election?
If we observe Bitcoin's price action in November 2012, around two weeks before the election, the digital asset plunged by 20% and didn’t recover until weeks later. It’s important to note that BTC was far more volatile in 2012 as trading volume was minimal.
-637395881053689856.png)
BTC past elections chart
In the past election in 2016, Bitcoin also had a significant crash around five days before the results. Similarly, it took BTC more than a week to fully recover. However, on both occasions, the digital asset experienced two colossal bull runs months later.
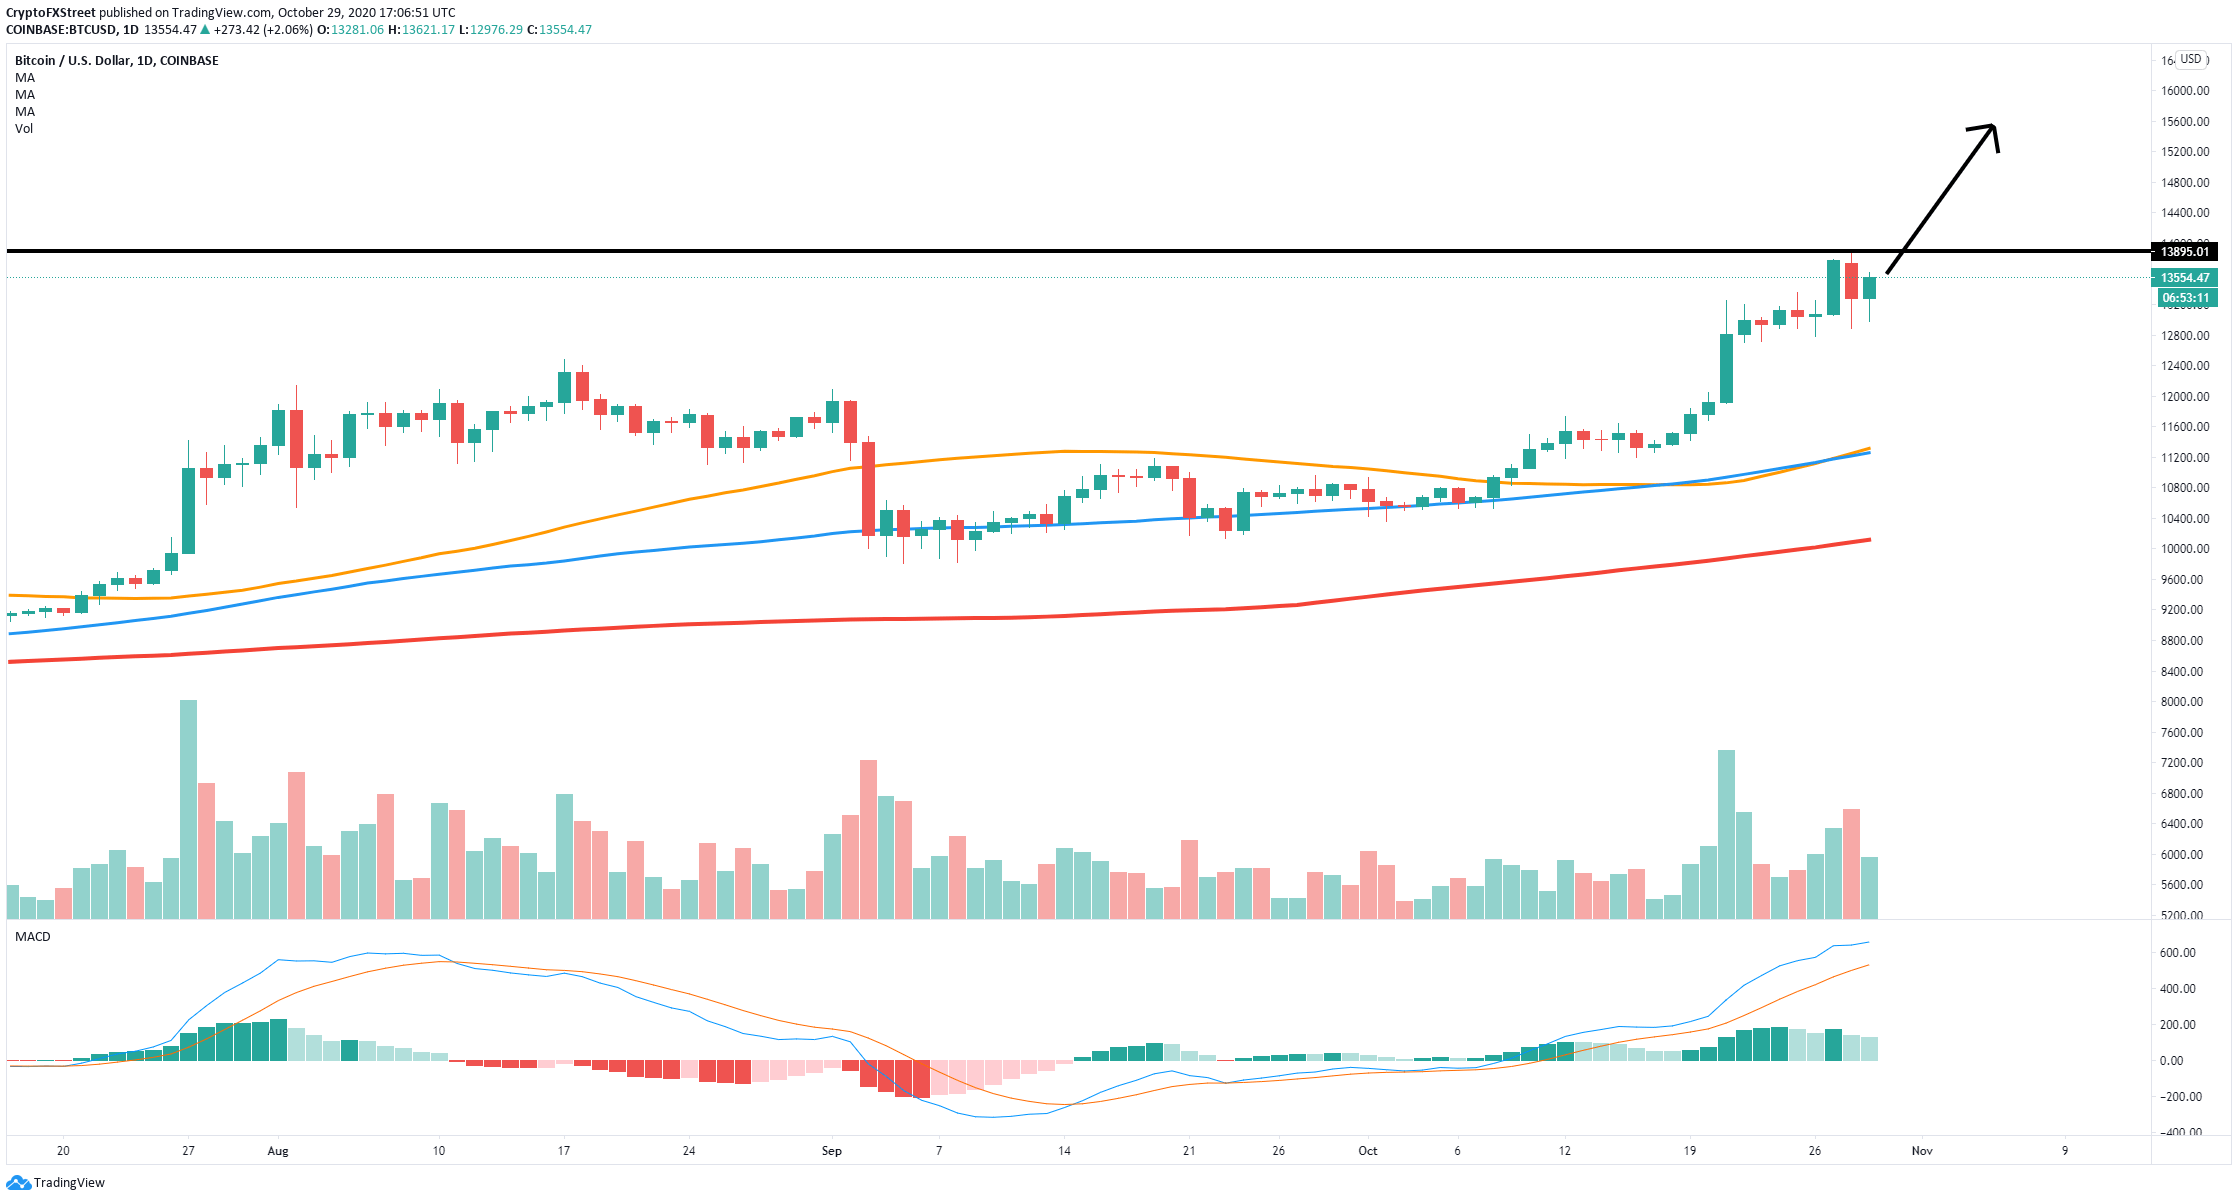
Less than a week away from the 2020 elections, Bitcoin continues trading above $13,000 at exactly $13,550 at the time of writing. A similar 12% drop, like the one seen in 2016, would push BTC down to $11,875.
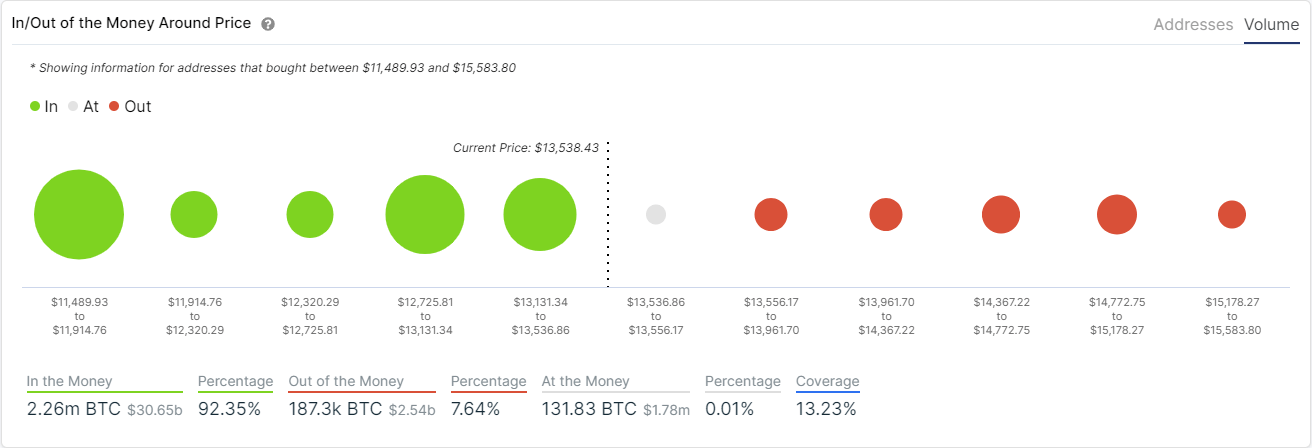
However, looking at the In/Out of the Money Around Price (IOMAP) chart, three critical support levels are observed on the way down. The area between $13,131 and $13,536. The range between $12,725 and $13,131 and finally $11,489-11,914.
BTC IOMAP chart
These three ranges have a lot of Bitcoin volume, meaning that many investors bought many coins. In comparison, the resistance ahead seems almost non-existent. Considering what the IOMAP chart shows, a drop below $12,725 seems unlikely.
BTC/USD daily chart
If Bitcoin can resume its bullish trend a few weeks after the elections, as it did in the previous ballots, the flagship cryptocurrency could easily jump towards the last high at $13,863 and as high as $15,583 as the IOMAP chart shows no significant resistance until that point.
Information on these pages contains forward-looking statements that involve risks and uncertainties. Markets and instruments profiled on this page are for informational purposes only and should not in any way come across as a recommendation to buy or sell in these assets. You should do your own thorough research before making any investment decisions. FXStreet does not in any way guarantee that this information is free from mistakes, errors, or material misstatements. It also does not guarantee that this information is of a timely nature. Investing in Open Markets involves a great deal of risk, including the loss of all or a portion of your investment, as well as emotional distress. All risks, losses and costs associated with investing, including total loss of principal, are your responsibility. The views and opinions expressed in this article are those of the authors and do not necessarily reflect the official policy or position of FXStreet nor its advertisers.