Cardano Price Prediction: ADA could be poised for a potentially deadly selloff
|- ADA is currently trading at $0.1 after a notable 41% price surge over the past week.
- The outlook for Cardano is quickly turning bearish as several indicators are showing a potentially deadly selloff.
Cardano established a new 2020-high on July 26 at $0.15. The digital asset is down 50% since its peak, and it’s currently trying to recover.
Several indicators are pointing towards a selloff
Although ADA price has been trending upwards, it seems that many indicators are starting to shift in favor of the bears.
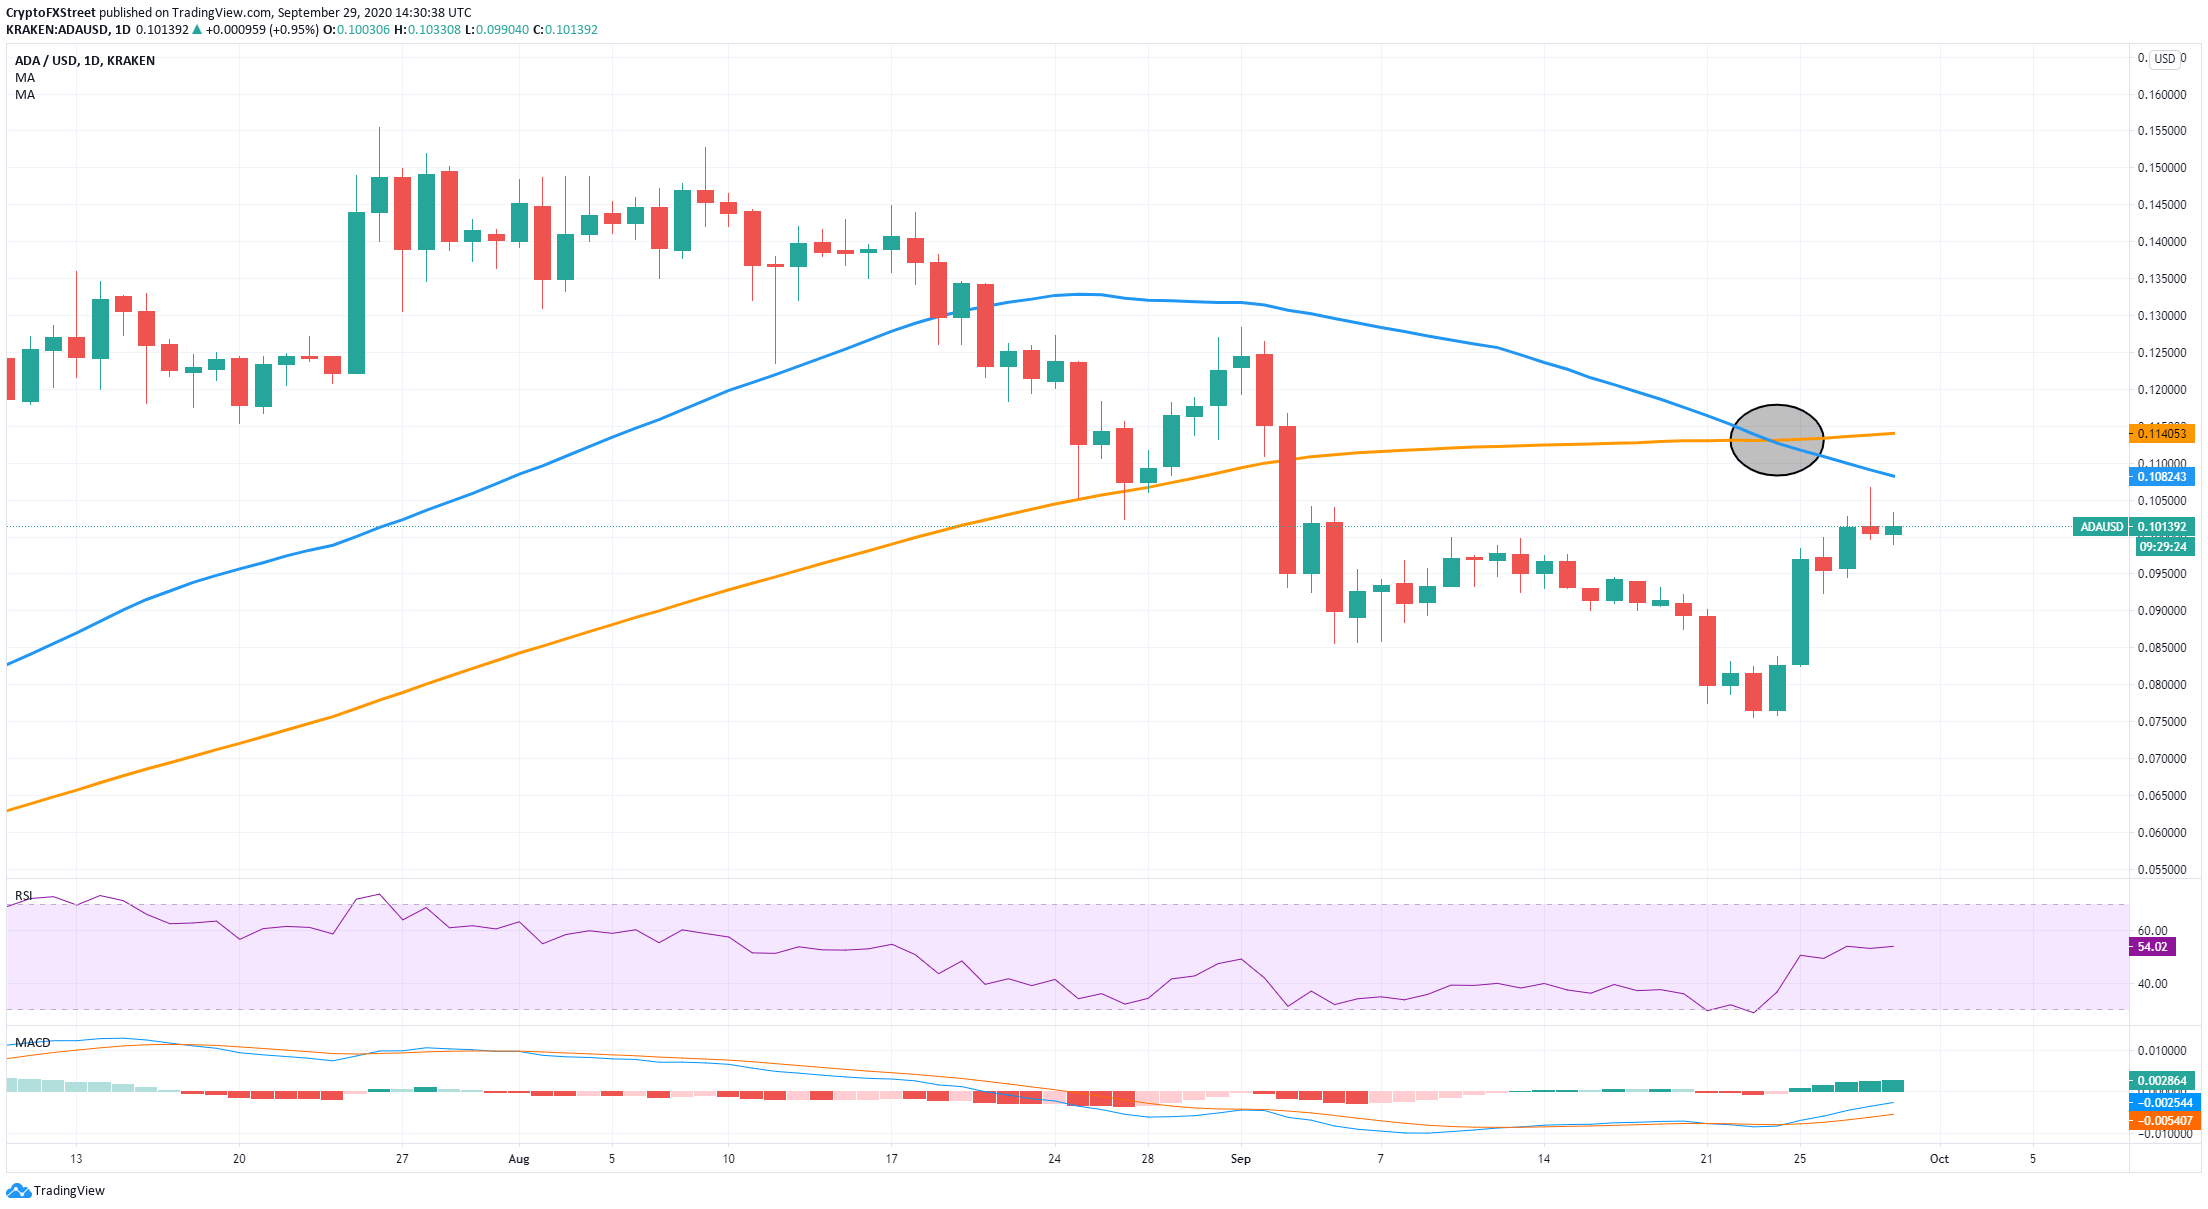
ADA/USD daily chart
On the daily chart, the 100-MA and the 50-MA had a death cross on September 23. This pattern indicates the potential for a major selloff even though ADA is rebounding. The 50-MA at $0.108 will act as a resistance level in the upcoming days.
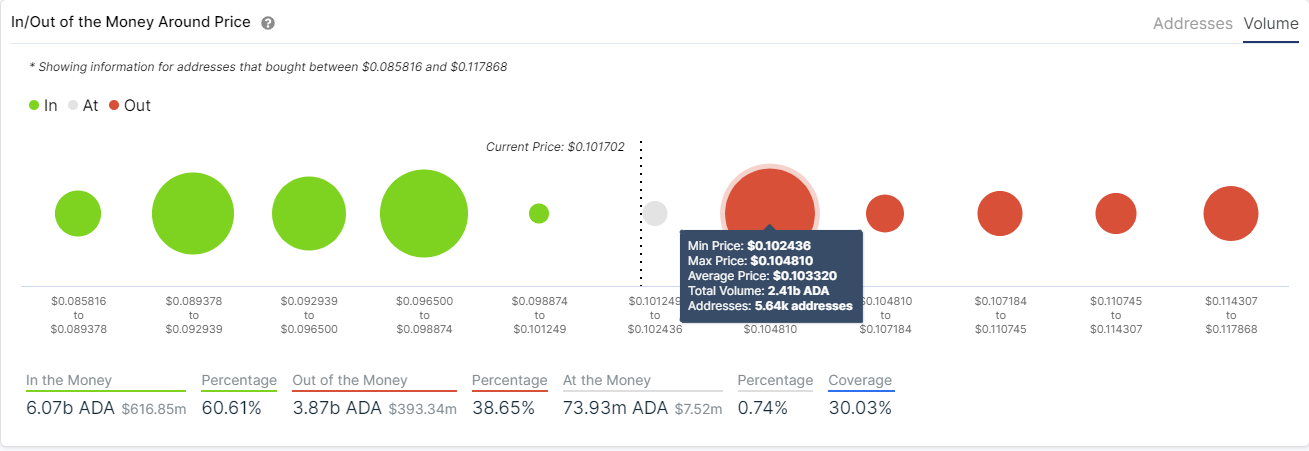
ADA IOMAP Chart
Looking at the In/Out of the Money Around Price chart by IntoTheBlock, it certainly seems that bulls face a lot of resistance ahead. The range between $0.102 and $0.104 is a giant resistance level where more than 5,000 addresses bought 2.4 billion ADA coins.
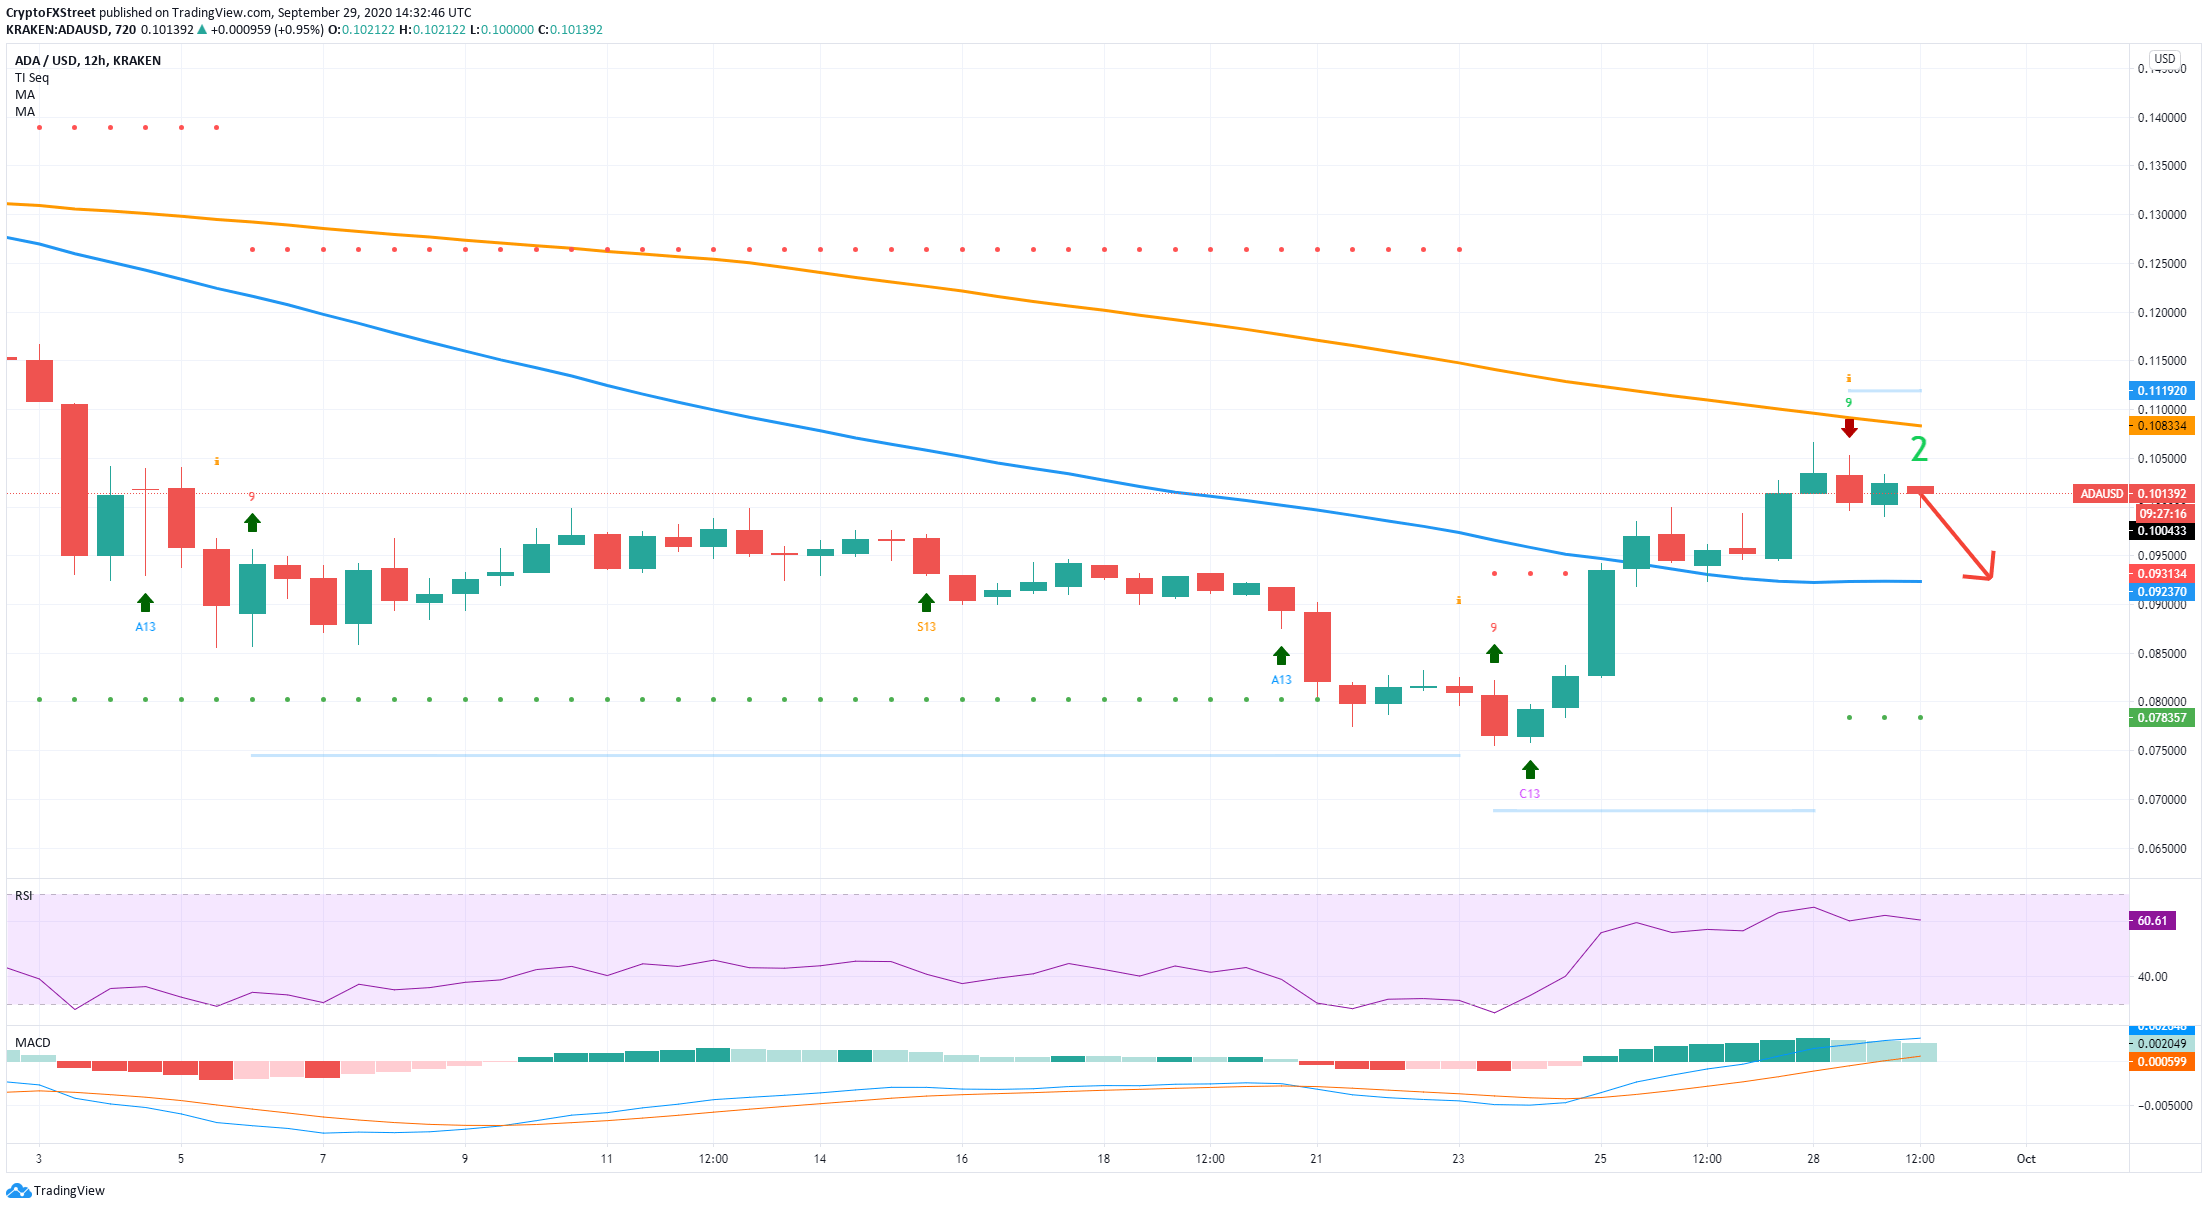
ADA/USD 12-hour chart
On the 12-hour chart, the TD sequential indicator has presented a sell signal on September 28. ADA faces the 100-MA at $0.108 as a resistance level, and bears are looking at least for a re-test of the 50-MA at $0.092. The RSI is also quite extended, while the MACD remains bullish.
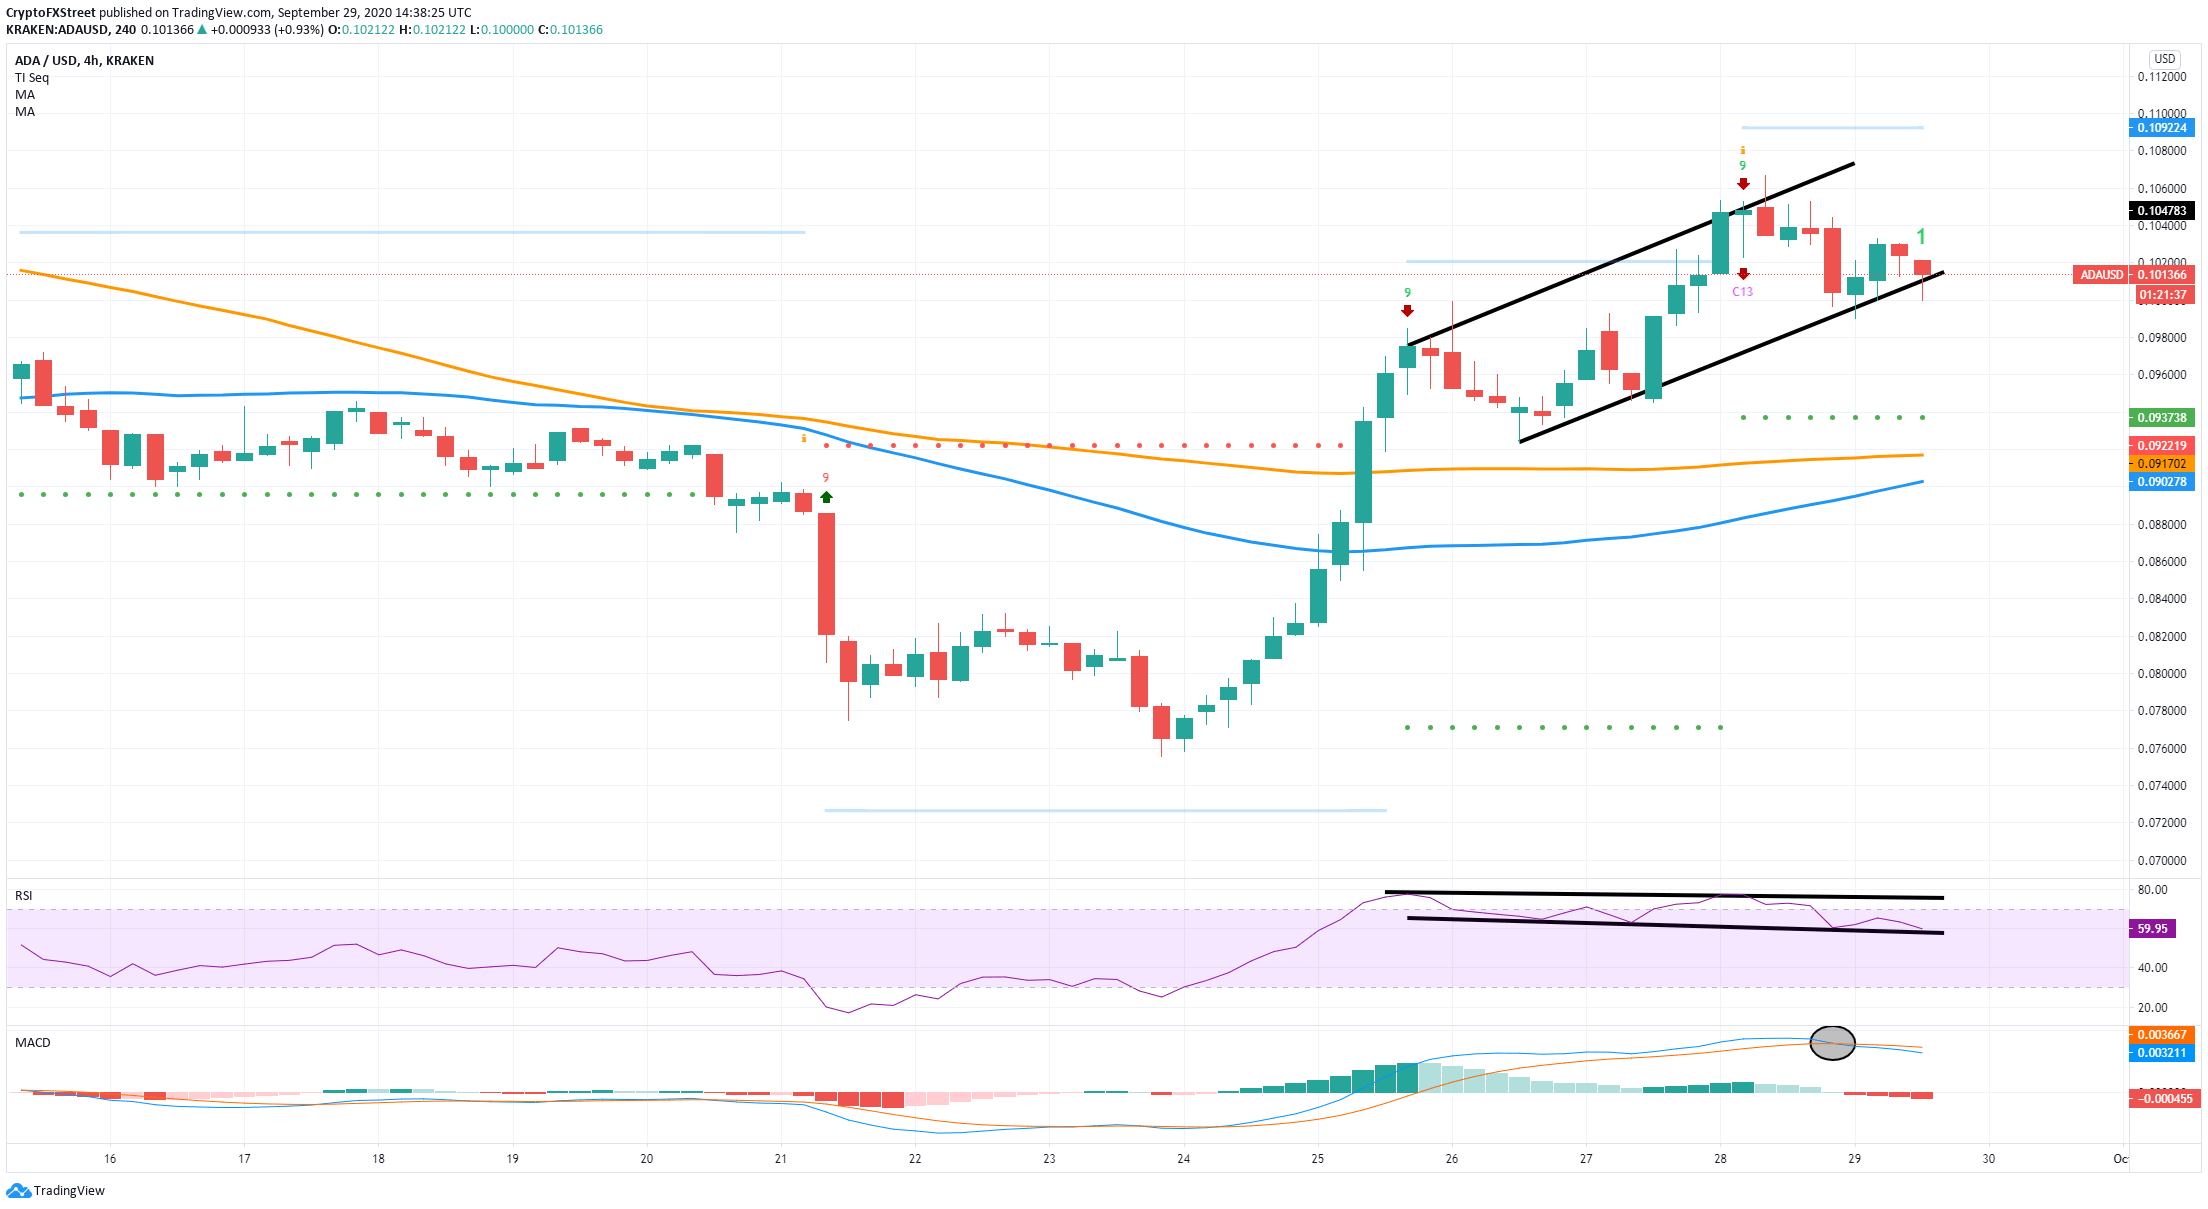
ADA/USD 4-hour chart
The RSI and the price have created a bearish divergence, which happens when the price posts higher highs, but the RSI doesn’t. Additionally, the MACD just crossed bearishly, and the TD sequential indicator presented another sell signal around 36 hours ago.
The bearish outlook is solid; however, the IOMAP chart shows a ton of support below $0.10. Bears still need to be extremely careful as the only significant resistance level is established between $0.102 and $0.104, meaning that ADA can continue with its recent uptrend if this area is cracked.
ADA New Addresses Chart
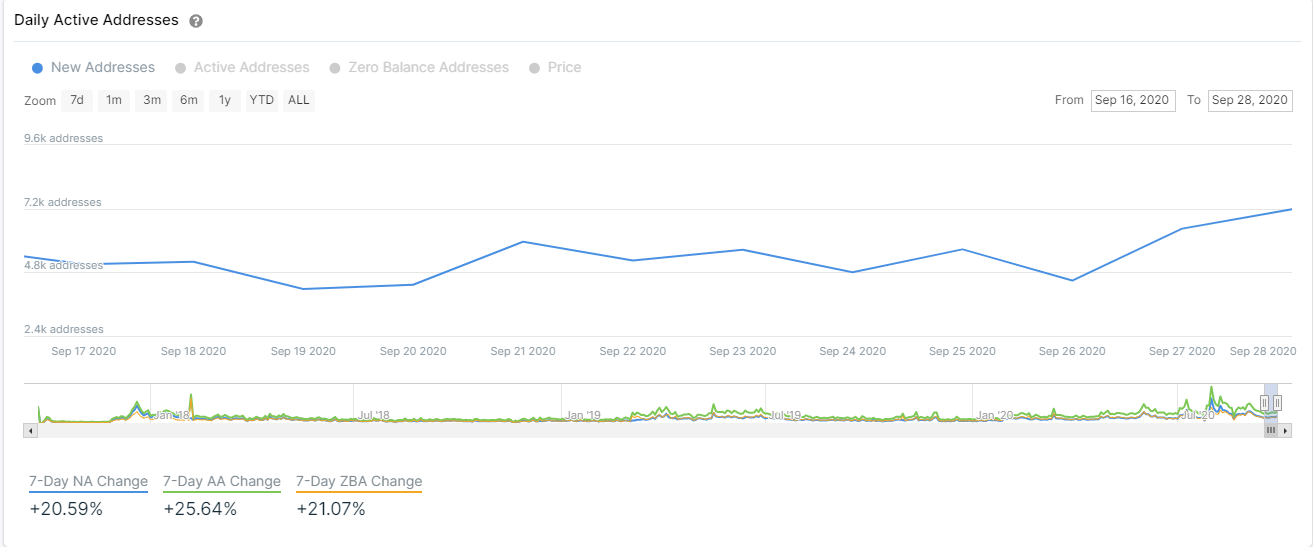
Additionally, according to the chart provided by IntoTheBlock, the number of new ADA addresses joining the network has increased over the past week from a low of 4,500 addresses to a current peak of 7,000. The most recent spike in the number of new addresses happened between August 30 and September 3. At the time, the price of ADA reacted positively to this metric and jumped by 25% within days.
If history repeats itself, the break of the $0.104 resistance point can lead ADA to test the 50-MA resistance at $0.108 and the 100-MA at $0.114.
Information on these pages contains forward-looking statements that involve risks and uncertainties. Markets and instruments profiled on this page are for informational purposes only and should not in any way come across as a recommendation to buy or sell in these assets. You should do your own thorough research before making any investment decisions. FXStreet does not in any way guarantee that this information is free from mistakes, errors, or material misstatements. It also does not guarantee that this information is of a timely nature. Investing in Open Markets involves a great deal of risk, including the loss of all or a portion of your investment, as well as emotional distress. All risks, losses and costs associated with investing, including total loss of principal, are your responsibility. The views and opinions expressed in this article are those of the authors and do not necessarily reflect the official policy or position of FXStreet nor its advertisers.