Bitcoin Price Prediction: BTC investors increase their bets to $30,000 by January 2021
|- The price of Bitcoin is around $13,300, bounded inside a daily uptrend.
- Several on-chain analysis platforms reported that the largest Bitcoin options trade ever was just filed.
Bitcoin is trading around $13,300 after a rally from $10,000. Many investors seem to be targeting at least $30,000 by January 2021. Statistics from Skew show that Jan21 calls crossed 10,000 with a 1:4 ratio on $32,000/36,000.
10k Jan21 calls just crossed, looks like a 1x4 32k/36k Call Ratio.
— skew (@skewdotcom) October 30, 2020
Largest listed trade ever on Bitcoin options. pic.twitter.com/TKdYhSPnvw
10k Jan21 calls just crossed, looks like a 1x4 32k/36k Call Ratio.
— skew (@skewdotcom) October 30, 2020
Largest listed trade ever on Bitcoin options. pic.twitter.com/TKdYhSPnvw
Essentially, investors are betting on Bitcoin's price to reach more than $30,000 by the end of January 2021. The flagship cryptocurrency is facing bearish and bullish indicators. On one hand, the potential double top on the weekly chart is negative. However, the IOMAP and other indicators show very little resistance to the upside.
Is Bitcoin on its way to $30,000?
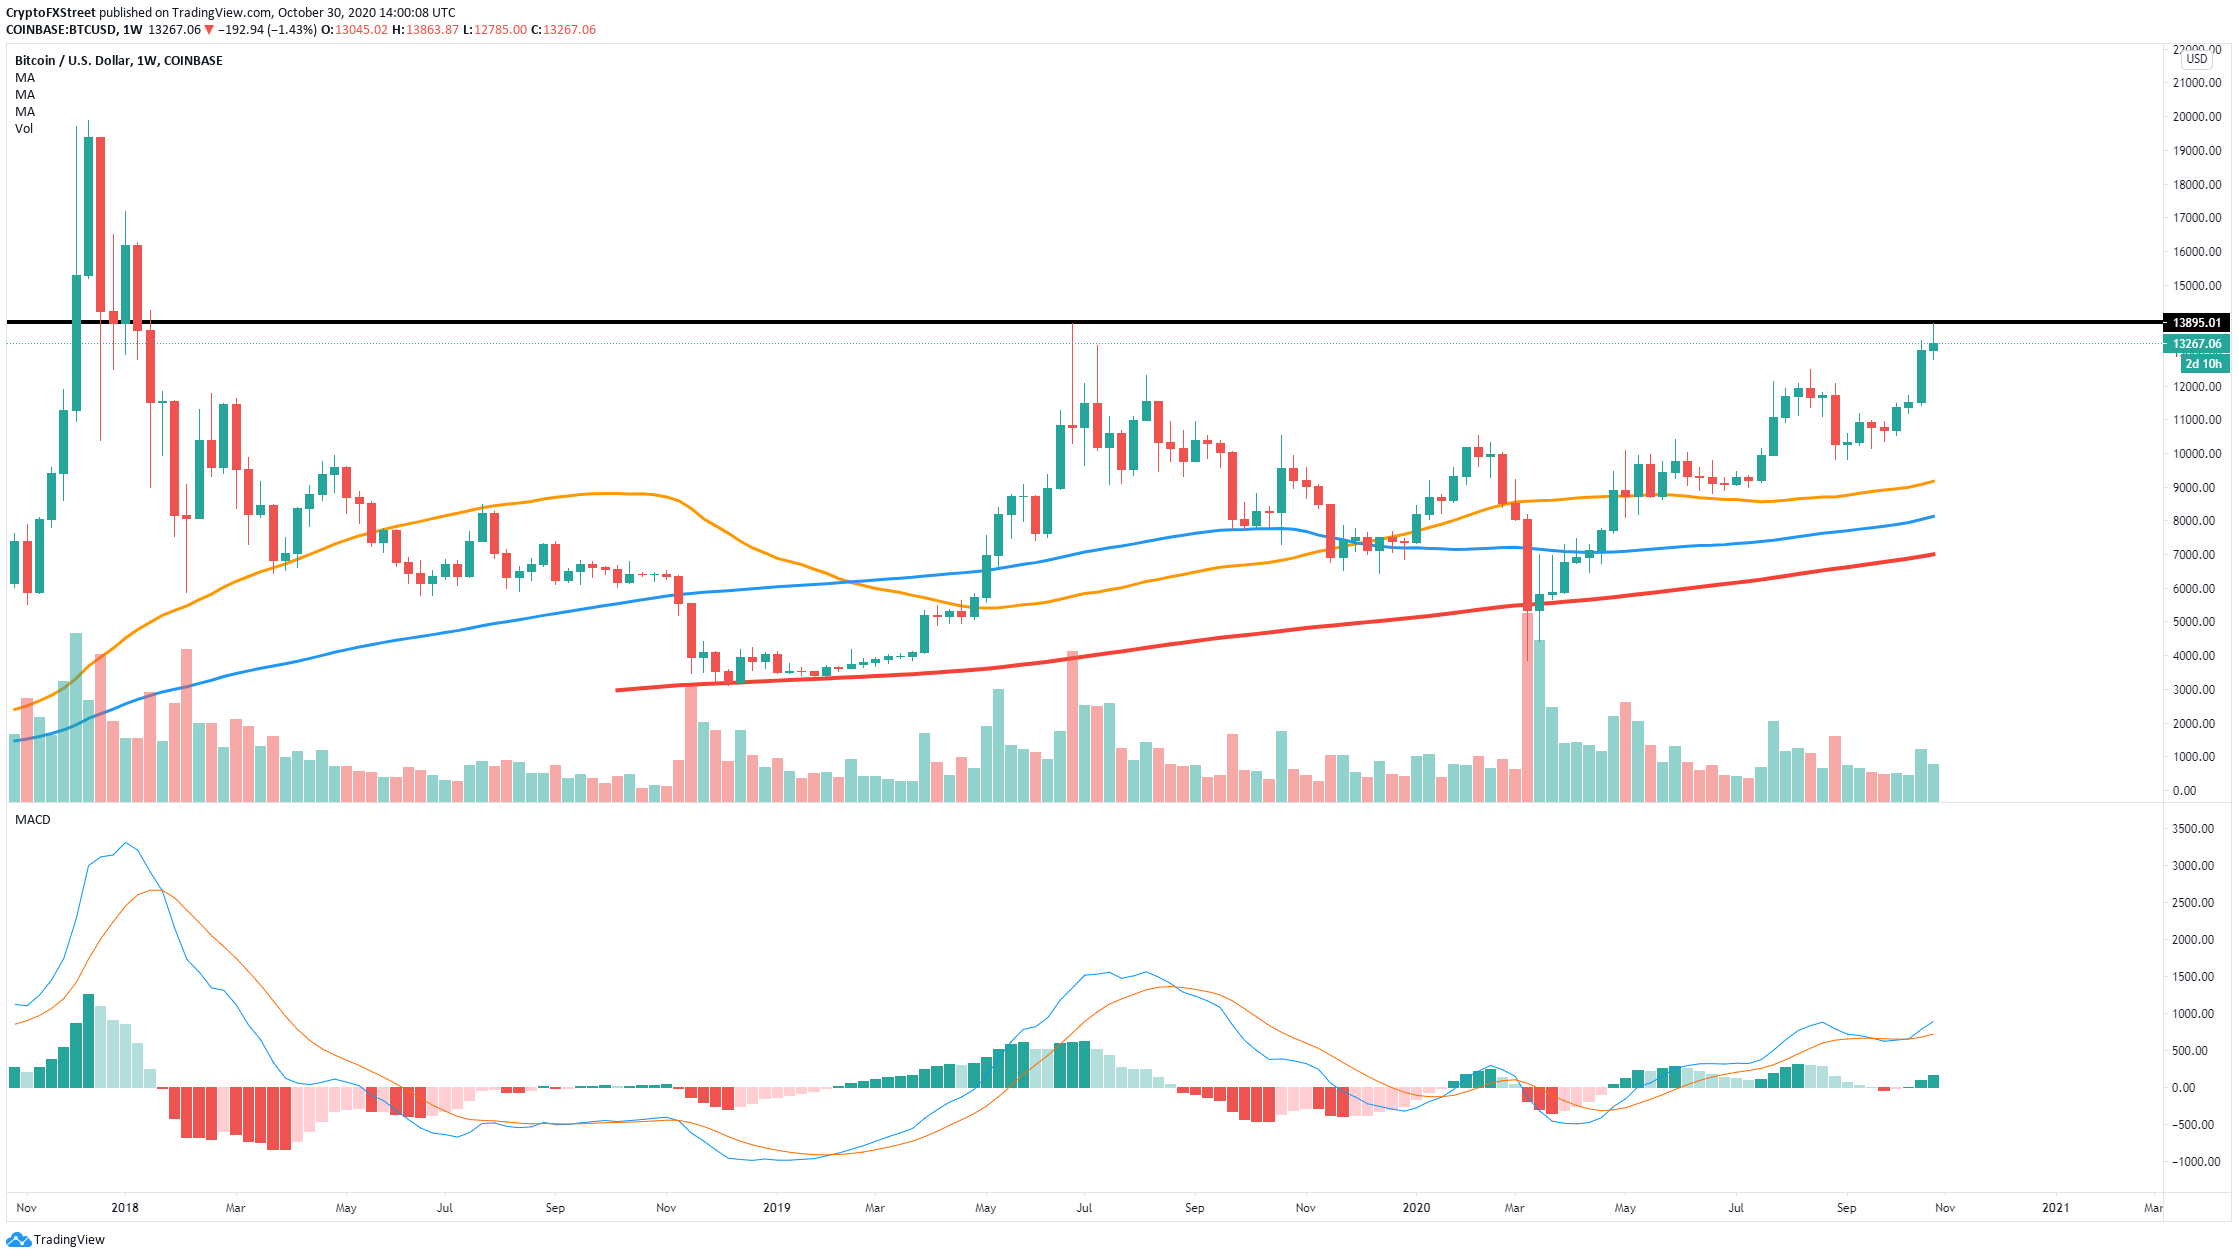
Bitcoin just hit $13,863 on October 28, a price point identical to the one established on June 24, 2019, at $13,868, which suggests the potential of a double top on the weekly chart. So far, the price of BTC slipped to $12,785 but recovered at $13,280 currently.
Despite the recent rejection, the weekly uptrend is intact as basically any price point above $9,800 can be viewed as a higher low. The MACD flipped bullish again on October 12, and it's gaining momentum which indicates there is still a lot of buying power.
BTC/USD weekly chart
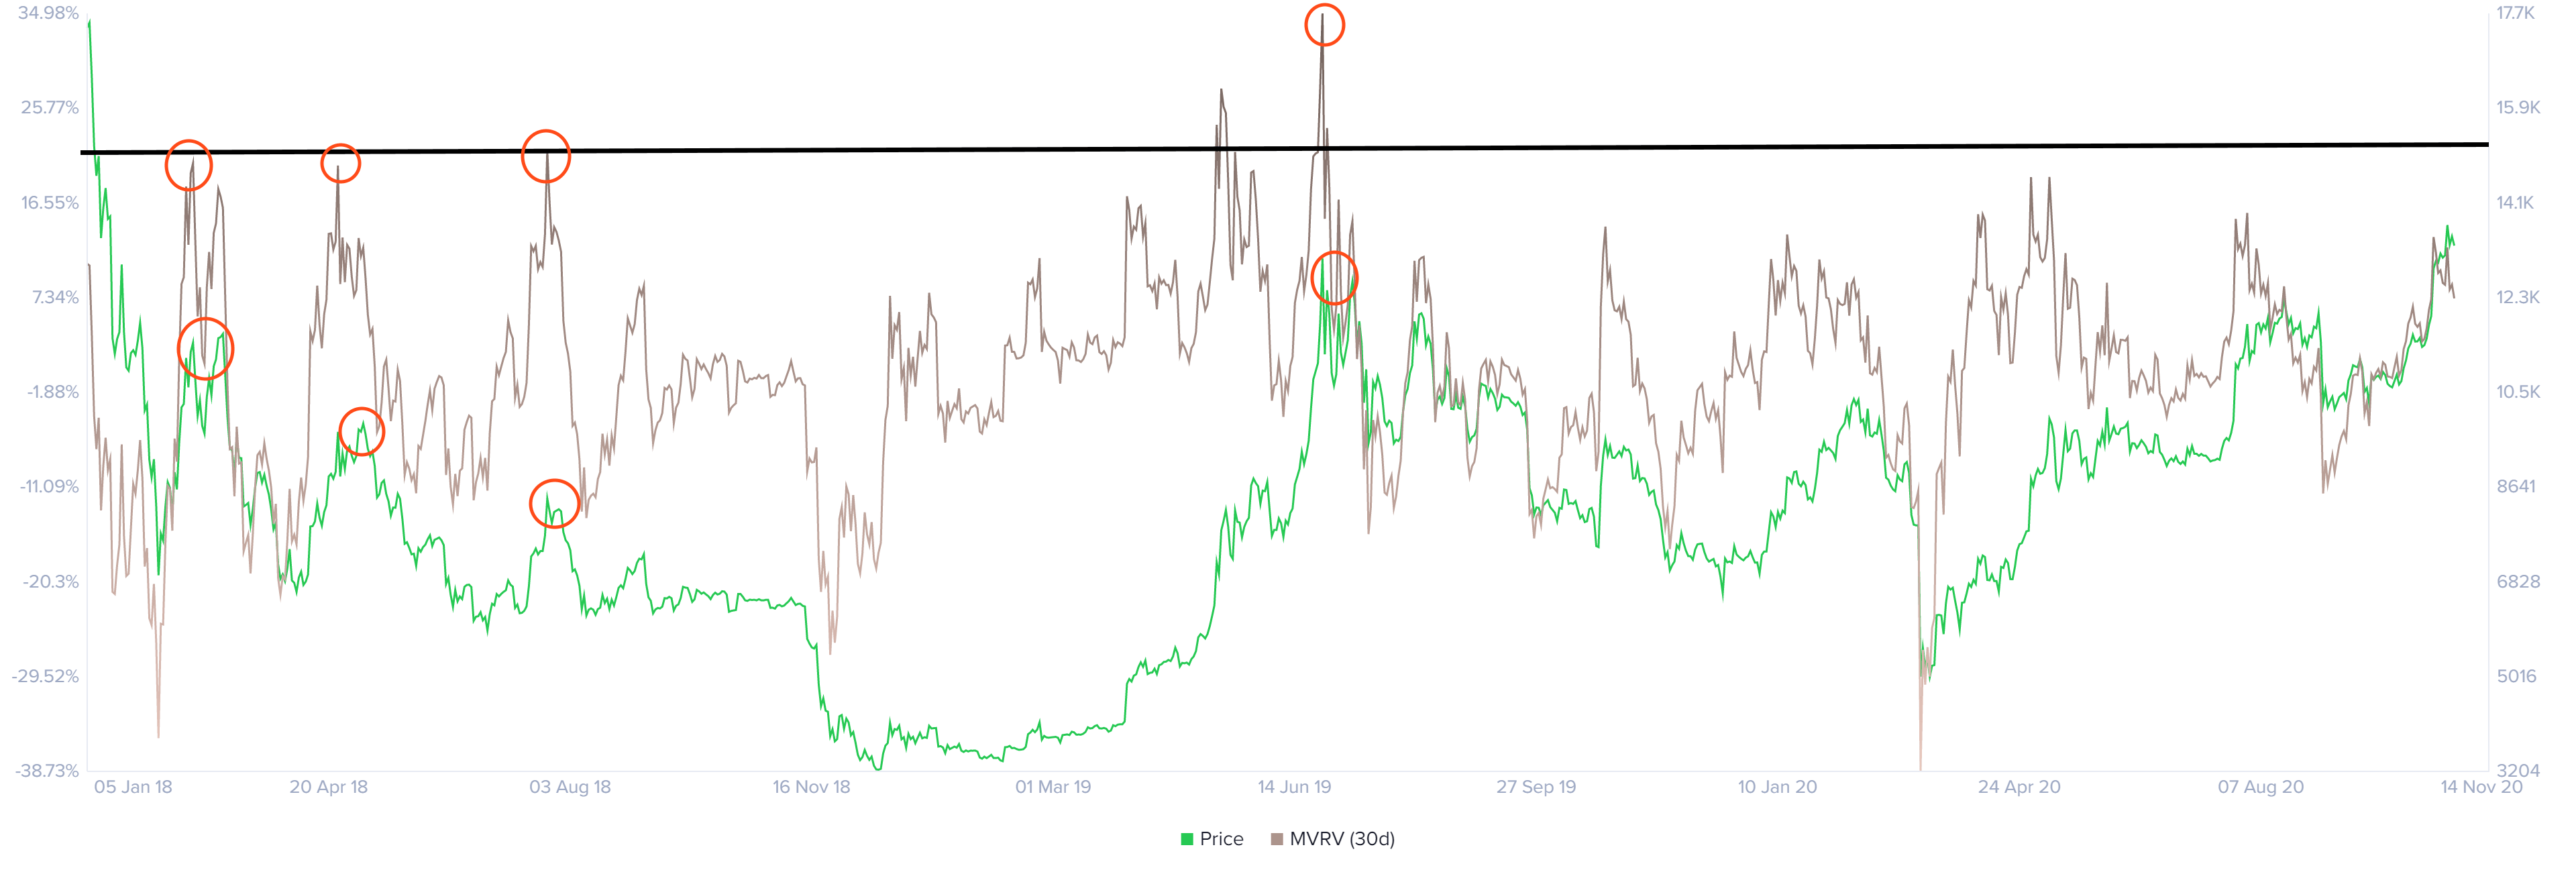
Bitcoin's Market-Value-to-Realized Value (MVRV) is not in the danger zone above 18% just yet. In the past, whenever this metric crossed above this area, Bitcoin suffered a substantial pullback. However, it seems that BTC still has some room to work with before a correction.
Bitcoin MVRV (30d) chart
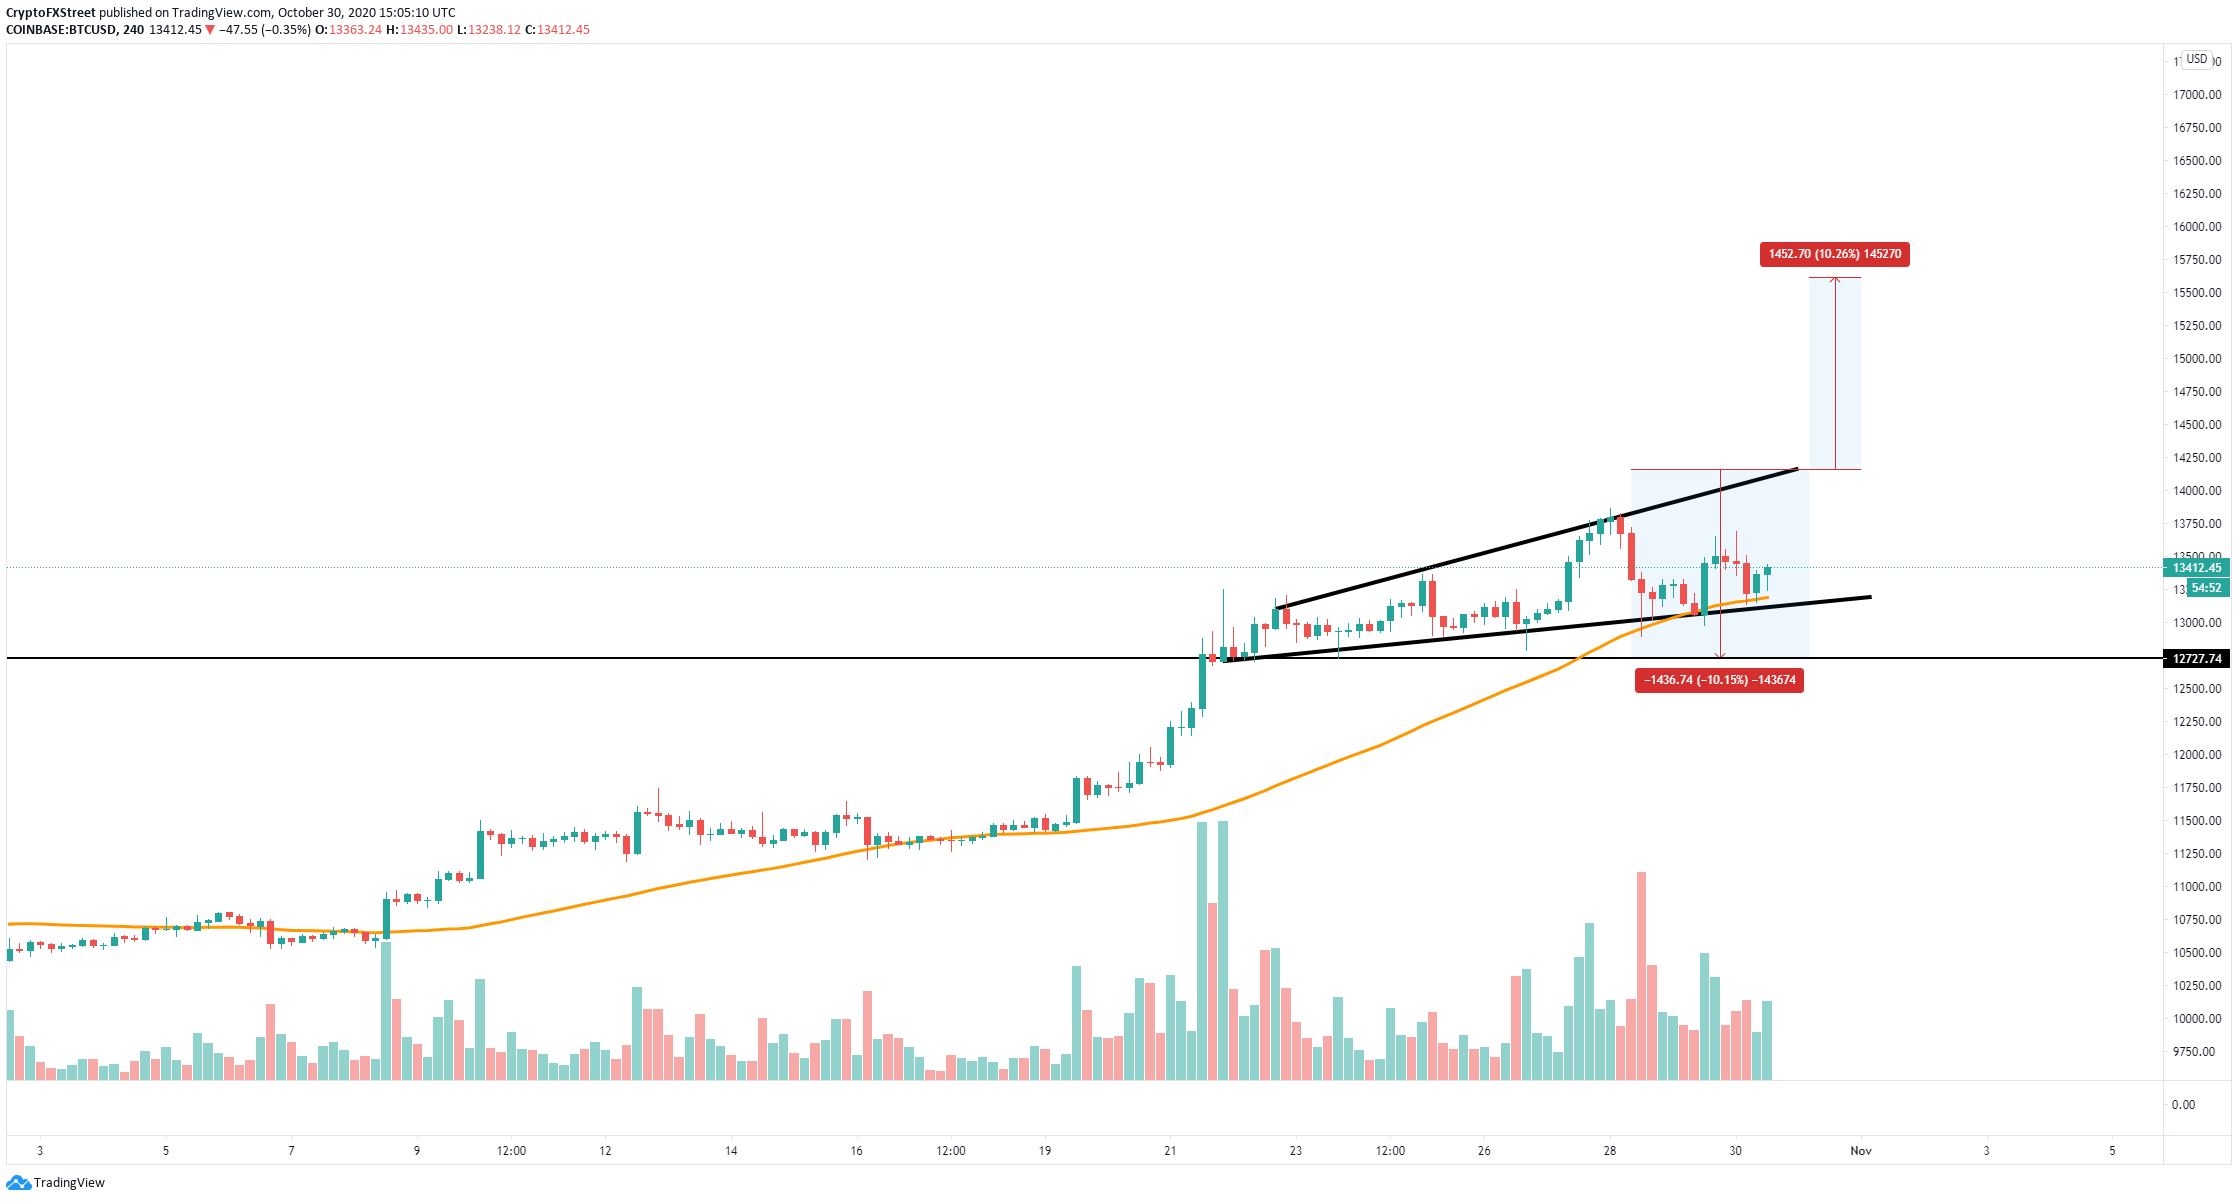
On the 4-hour chart, Bitcoin's price has painted an ascending broadening wedge with the current resistance at around $14,000 and a price target of $15,500. So far, the flagship cryptocurrency has defended the 50-SMA at $13,190, which continues to act as a robust support level.
BTC/USD 4-hour chart
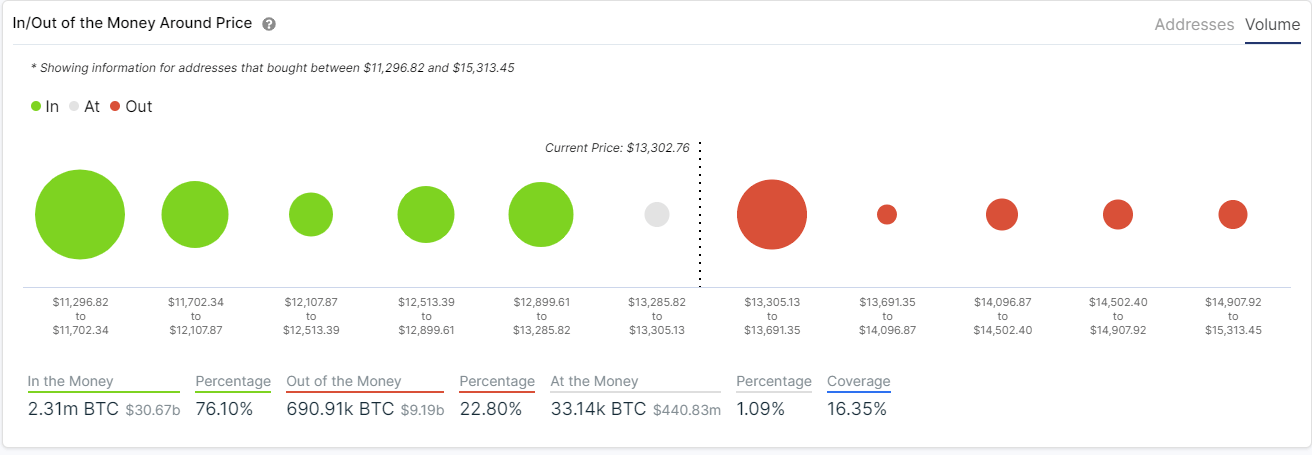
The In/Out of the Money Around Price chart continues to show very little resistance ahead with only one significant area between $13,300 and $13,700. Here, approximately 1.2 million addresses had previously purchased over 620,000 BTC. Holders within this range would likely attempt to break even in their long positions, creating some downward pressure to the on-going uptrend.
BTC IOMAP chart
On the other hand, the IOMAP cohorts show that the most significant support wall is located at $13,140. More than 700,000 addresses are holding over 570,000 BTC around this price level. A spike in selling pressure that pushes Bitcoin below this hurdle may have the strength to send it towards the next critical area of support at $12,000.
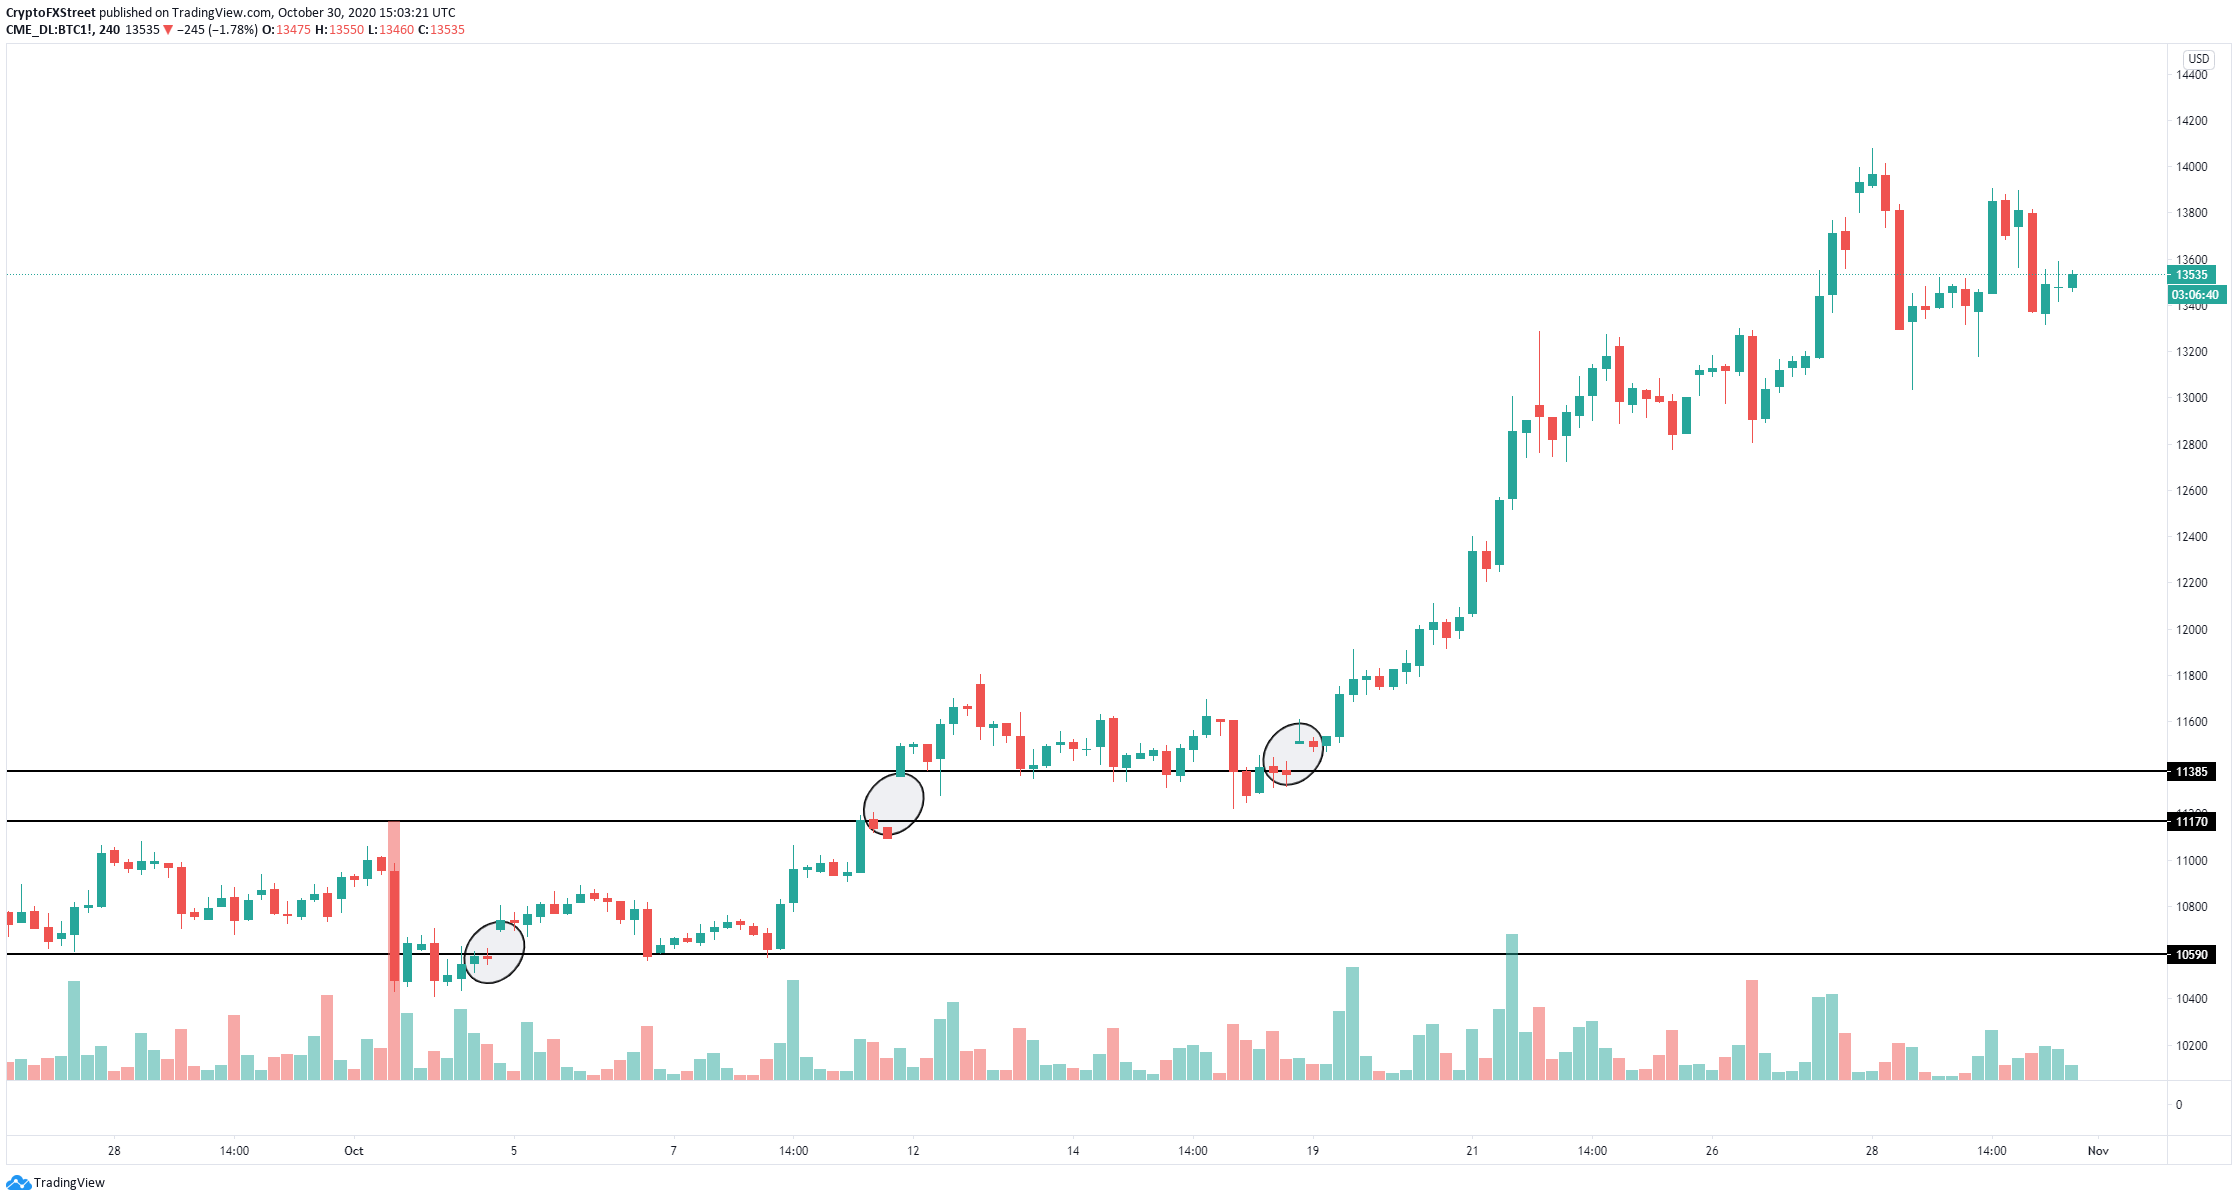
Bitcoin CME chart
Other bearish price points can be found using the CME Bitcoin Futures chart. There are currently three gaps that formed in early October that have not been filled yet. These gaps sit at $11,400, $11,200, and $10,600, respectively.
Information on these pages contains forward-looking statements that involve risks and uncertainties. Markets and instruments profiled on this page are for informational purposes only and should not in any way come across as a recommendation to buy or sell in these assets. You should do your own thorough research before making any investment decisions. FXStreet does not in any way guarantee that this information is free from mistakes, errors, or material misstatements. It also does not guarantee that this information is of a timely nature. Investing in Open Markets involves a great deal of risk, including the loss of all or a portion of your investment, as well as emotional distress. All risks, losses and costs associated with investing, including total loss of principal, are your responsibility. The views and opinions expressed in this article are those of the authors and do not necessarily reflect the official policy or position of FXStreet nor its advertisers.