Bitcoin Price Prediction: Bitcoin facing potential pullback before a final push to $20,000
|- BTC is trading at $12,947 after a colossal rally towards $13,250.
- It seems that nothing is stopping Bitcoin; however, some indicators have flipped bearish.
Bitcoin is back above 60% market dominance and climbed above $13,000 for the first time since June 2019. In the past week alone, BTC's total market capitalization has increased by over $31 billion.
Bitcoin could be facing a retrace in the short-term
The flagship cryptocurrency is up 13% in the past 48 hours after a massive announcement from PayPal to support digital assets like BTC, ETH, BCH, and LTC. Bulls are eying up $20,000; however, there is a chance that Bitcoin will face a pullback first.
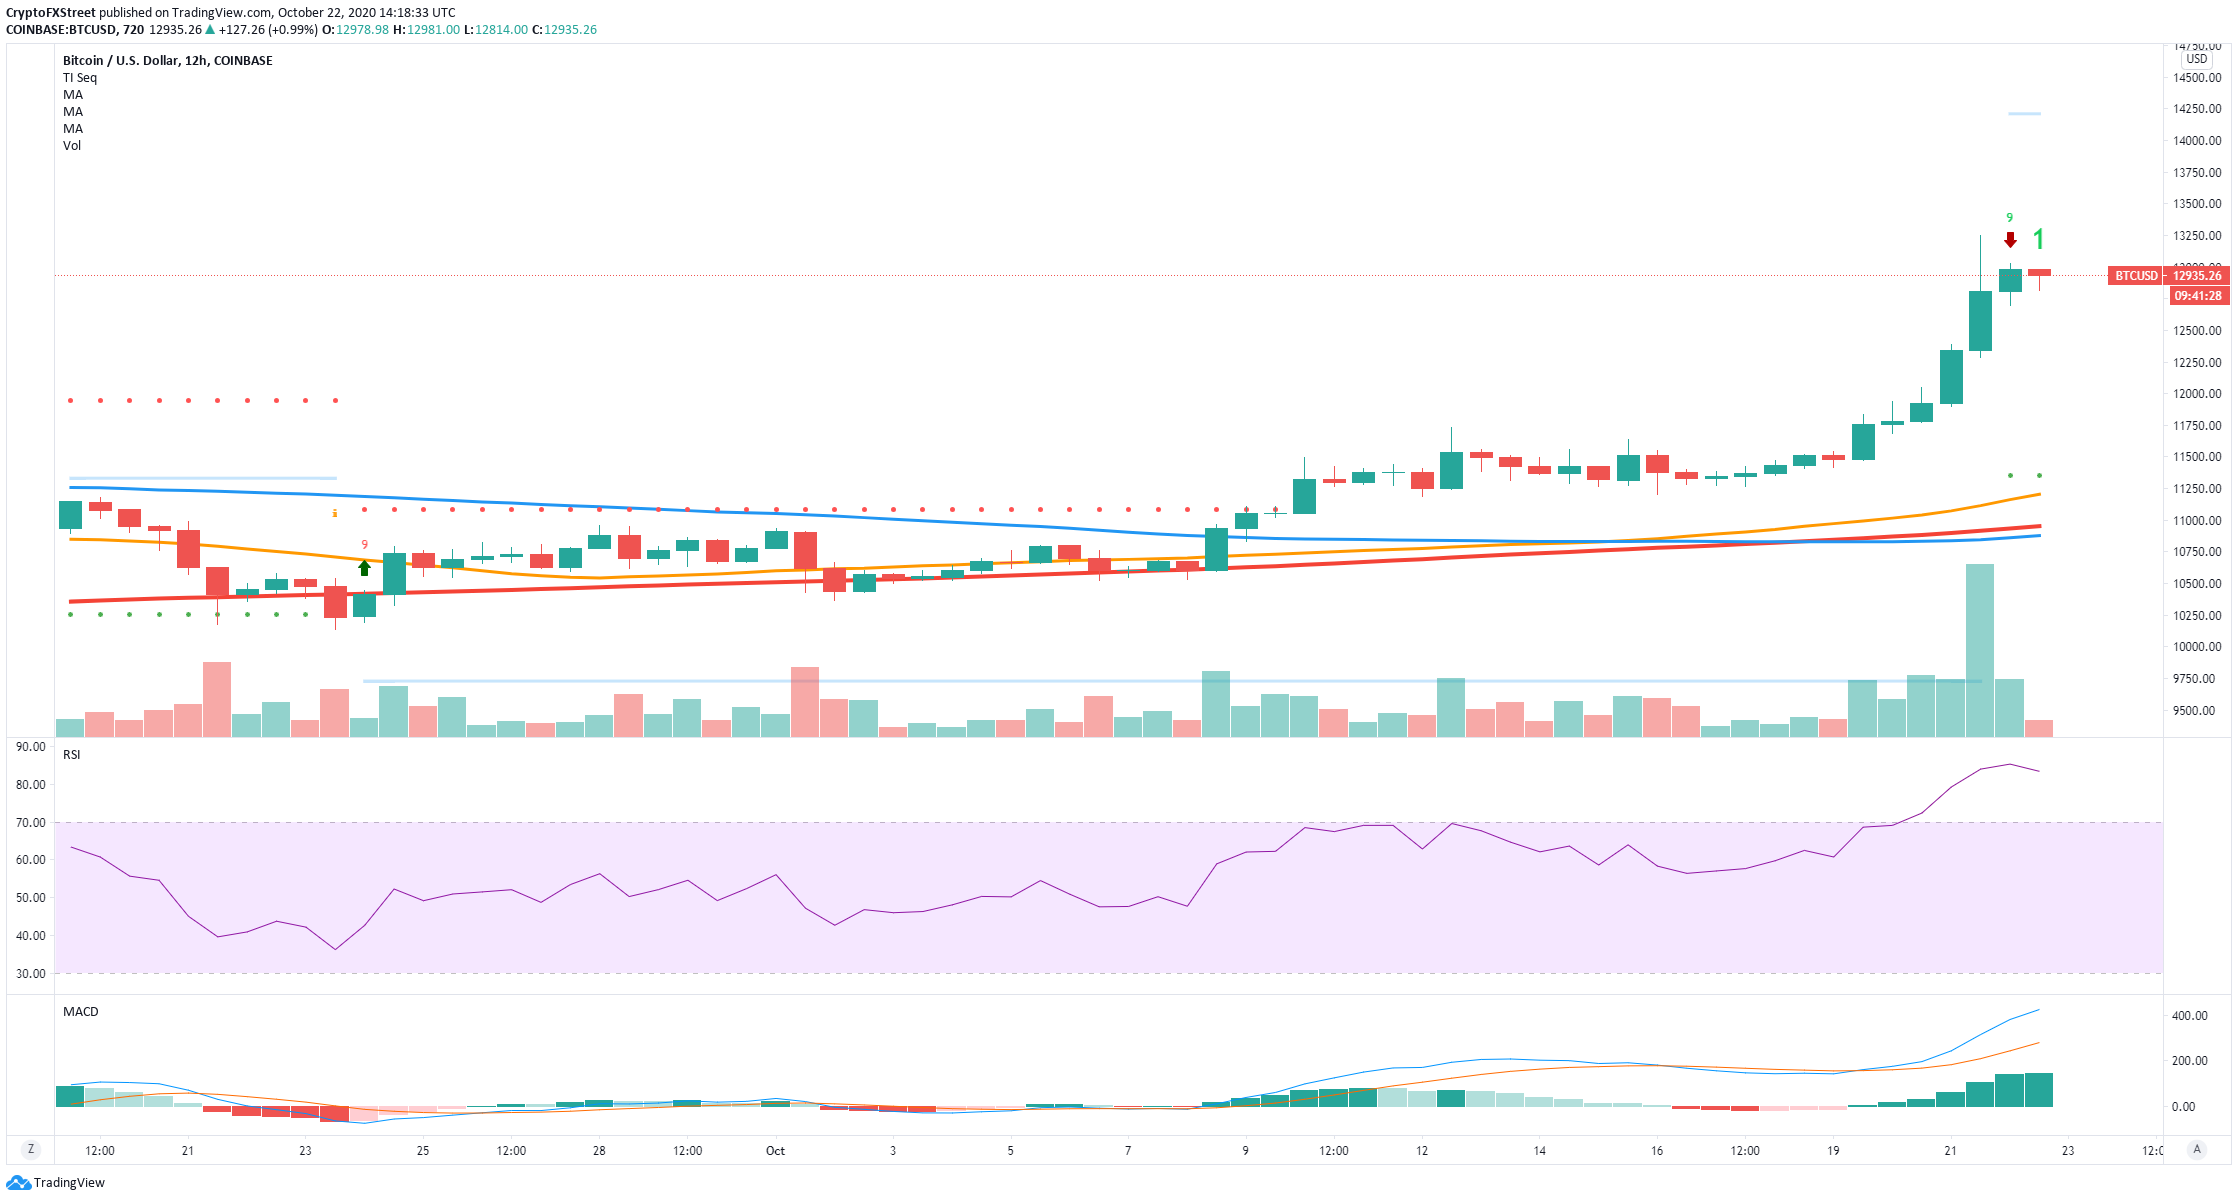
BTC/USD 12-hour chart
The TD sequential indicator has presented a sell signal on the 12-hour chart, the first since September 18. Additionally, the RSI is heavily overextended, which also adds further selling pressure to Bitcoin.
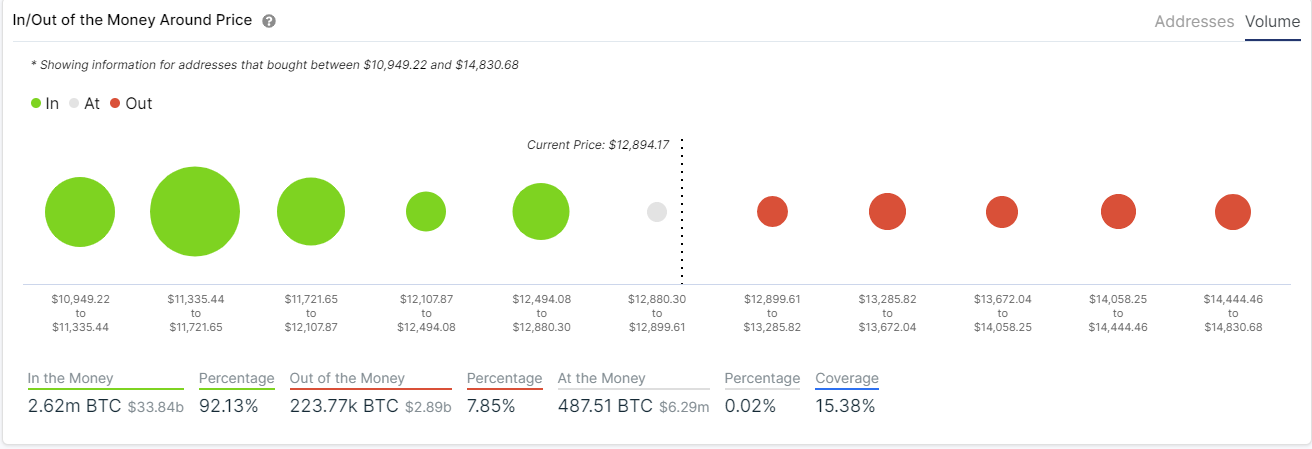
BTC IOMAP Chart
The In/Out of the Money Around Price chart shows the next substantial support area to be between $11,721 and $12,107, which means that Bitcoin could see a pullback down to $12,107 and possibly the psychological support level at $12,000 to re-test it.
BTC Holders Distribution Chart
 [16.26.04, 22 Oct, 2020]-637389739852616787.png)
Another concerning trend can be seen using the BTC Holders Distribution chart. It seems that the number of whales holding between 10,000 and 100,000 coins has decreased by seven in the past week, indicating that they are taking profits.
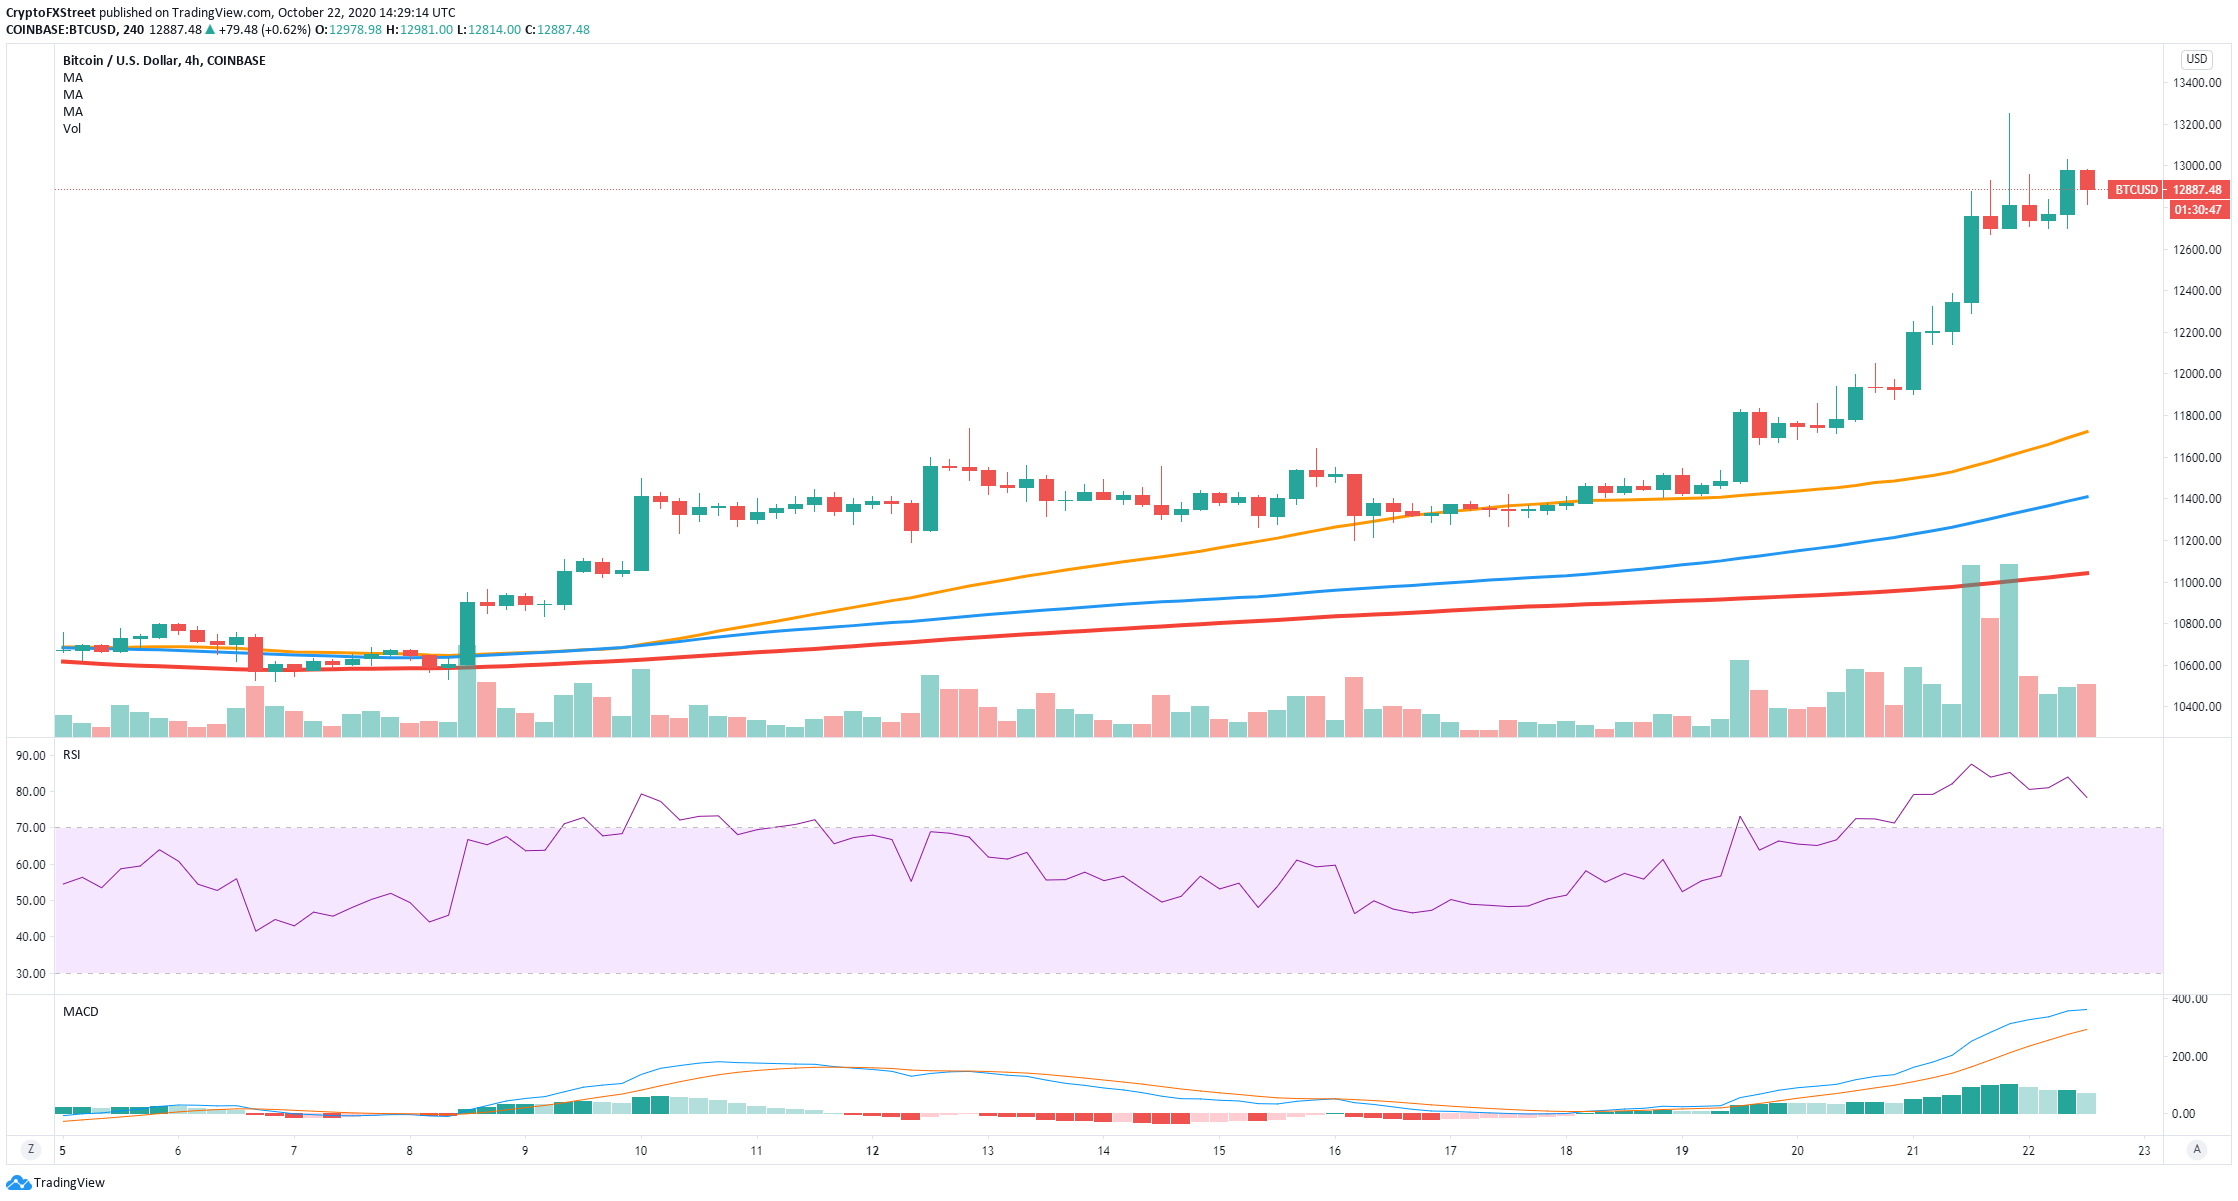
BTC/USD 4-hour chart
Nonetheless, most time frames are still in favor of the bulls, which are holding the uptrends. The 4-hour chart is presenting a possible bull flag with a MACD gaining a lot of strength. The price is way above the SMAs and EMAs.
Observing the same IOMAP chart above, we can also notice that resistance above the $12,899 level is feeble compared to support. Another breakout above the $13,000 point can drive BTC up to $14,000.
Crucial price levels for Bitcoin investors
Despite Bitcoin's bullish sentiment and the entire cryptocurrency market, the flagship cryptocurrency could be facing a short-term pullback before climbing to its all-time high of $20,000. Validation of the sell signal on the 12-hour chart can push BTC down to $12.000.
On the other hand, bulls are still in control over most time frames and are eying up $14,000 as the next price target. A breakout above the new psychological resistance level at $13,000 can achieve this goal as the IOMAP chart shows very little opposition to the upside.
Information on these pages contains forward-looking statements that involve risks and uncertainties. Markets and instruments profiled on this page are for informational purposes only and should not in any way come across as a recommendation to buy or sell in these assets. You should do your own thorough research before making any investment decisions. FXStreet does not in any way guarantee that this information is free from mistakes, errors, or material misstatements. It also does not guarantee that this information is of a timely nature. Investing in Open Markets involves a great deal of risk, including the loss of all or a portion of your investment, as well as emotional distress. All risks, losses and costs associated with investing, including total loss of principal, are your responsibility. The views and opinions expressed in this article are those of the authors and do not necessarily reflect the official policy or position of FXStreet nor its advertisers.