Bitcoin Top Price Prediction: Bashers have 13 technical reasons to sell BTC/USD on Friday the 13th – Confluence Detector
|The price of Bitcoin is stable after a few turbulent days, but the technical picture does not look good for the cryptocurrency. Those bashing bitcoin have good reasons to sell BTC/USD and head to the beach.
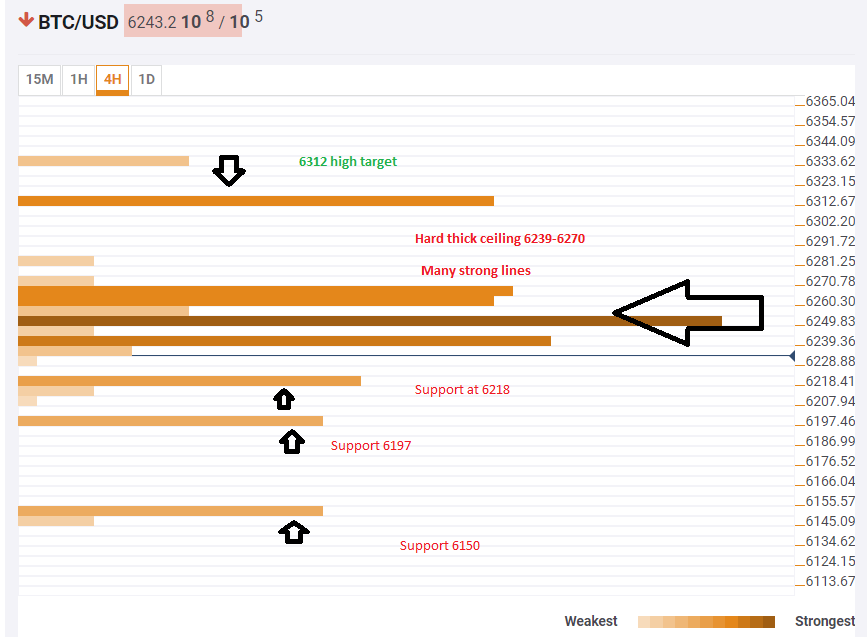
The Technical Confluence Indicator shows that the area between $6,239 and $6,270 consists of no less than 13 technical lines of resistance that may limit any upside movement. Here is the list:
- The Simple Moving Average 5-1 hour.
- SMA 5-15m
- SMA 10-15m
- Bolinger Band 15m-Middle (Standard Deviation 2.2).
- SMA 10-one-hour.
- Fibonacci 23.6% one-month.
- Bolinger Band 15m-Upper.
- Fibonacci 61.8% one-day.
- SMA 200-15m
- SMA 50-1h
- One-week low
- SMA 10-4h
- Bolinger Band 15m Lower.
Should the pair run up through this concrete ceiling, the next target is $6,312 which is the robust Pivot Point one-week Support 1.
If what cannot go up must come down, there are only weak support lines that can cushion the fall. $6,218 is the convergence of the 4h-high and the Simple Moving Average 5-4h. $6,197 is the Fibonacci 38.2% one-day, and $6,150 is the meeting point of the Fibonacci 23.6% one-day and the Bolinger Band 1h-Lower.
Here is how it looks on the tool:
The Confluence Detector finds exciting opportunities using Technical Confluences. The TC is a tool to locate and point out those price levels where there is a congestion of indicators, moving averages, Fibonacci levels, Pivot Points, etc. Knowing where these congestion points are located is very useful for the trader, and can be used as a basis for different strategies.
This tool assigns a certain amount of “weight” to each indicator, and this “weight” can influence adjacents price levels. These weightings mean that one price level without any indicator or moving average but under the influence of two “strongly weighted” levels accumulate more resistance than their neighbors. In these cases, the tool signals resistance in apparently empty areas.
Information on these pages contains forward-looking statements that involve risks and uncertainties. Markets and instruments profiled on this page are for informational purposes only and should not in any way come across as a recommendation to buy or sell in these assets. You should do your own thorough research before making any investment decisions. FXStreet does not in any way guarantee that this information is free from mistakes, errors, or material misstatements. It also does not guarantee that this information is of a timely nature. Investing in Open Markets involves a great deal of risk, including the loss of all or a portion of your investment, as well as emotional distress. All risks, losses and costs associated with investing, including total loss of principal, are your responsibility. The views and opinions expressed in this article are those of the authors and do not necessarily reflect the official policy or position of FXStreet nor its advertisers.