USD/JPY Forecast: Climbs to weekly highs above 109.00 on unabated USD strength
Premium|Take advantage of 50% OFF on your first month.
Start your subscription and get access to all our original articles.
You have reached your limit of 5 free articles for this month.
Get Premium without limits for only $9.99 for the first month
Access all our articles, insights, and analysts.
UNLOCK OFFER- USD/JPY closed second straight day in the positive territory.
- US Dollar Index reached fresh multi-month highs on Thursday.
- US economy expanded at an annual rate of 4.3% in Q4.
The USD/JPY pair broke above 109.00 during the European trading hours and preserved its bullish momentum to touch a fresh weekly high of 109.24 in the late American session before closing the day with modest gains around 109.10.
The US Bureau of Economic Analysis (BEA) announced on Thursday that it revised up the fourth-quarter GDP growth to 4.3% from 4.1%. Moreover, the US Department of Labor reported that the Initial Jobless Claims fell by 97,000 to 684,000 in the week ending March 20. This was the lowest reading in nearly a year and was much better than analysts’ estimate of 730,000.
The US Dollar Index extended its rally in the second half of the day and advanced to its strongest level since mid-November at 92.91.
Meanwhile, the benchmark 10-year US Treasury bond yields edged modestly higher as FOMC members downplayed price concerns. Chicago Fed President Charles Evans argued that a 2.5% inflation would not be extraordinary and Atlanta Fed President Raphael Bostic noted that the expected jump in inflation will be big but not especially meaningful.
On Friday, the BEA will publish Personal Income, Personal Spending and Personal Consumption Expenditures (PCE) Price Index figures for February.
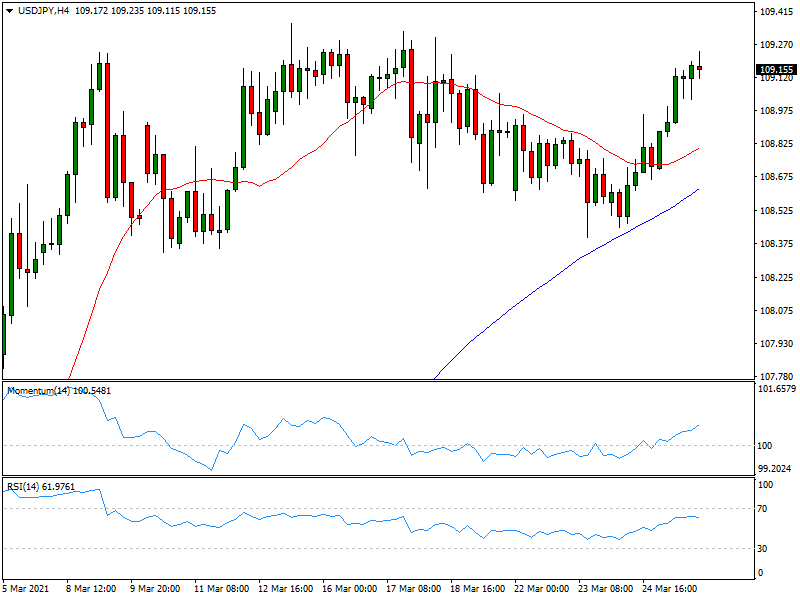
USD/JPY short-term technical outlook
On the four-hour chart, the Relative Strength Index (RSI) indicator sits around 60, suggesting that USD/JPY has more room on the upside before becoming technically overbought. The first hurdle is located at 109.40 (March high) ahead of 109.70 (June 8, 2020, high) and 110.00 (psychological level).
Supports could be seen at 109.00 (psychological level), 108.60 (50-period SMA) and 108.35 (March 11 low).
- USD/JPY closed second straight day in the positive territory.
- US Dollar Index reached fresh multi-month highs on Thursday.
- US economy expanded at an annual rate of 4.3% in Q4.
The USD/JPY pair broke above 109.00 during the European trading hours and preserved its bullish momentum to touch a fresh weekly high of 109.24 in the late American session before closing the day with modest gains around 109.10.
The US Bureau of Economic Analysis (BEA) announced on Thursday that it revised up the fourth-quarter GDP growth to 4.3% from 4.1%. Moreover, the US Department of Labor reported that the Initial Jobless Claims fell by 97,000 to 684,000 in the week ending March 20. This was the lowest reading in nearly a year and was much better than analysts’ estimate of 730,000.
The US Dollar Index extended its rally in the second half of the day and advanced to its strongest level since mid-November at 92.91.
Meanwhile, the benchmark 10-year US Treasury bond yields edged modestly higher as FOMC members downplayed price concerns. Chicago Fed President Charles Evans argued that a 2.5% inflation would not be extraordinary and Atlanta Fed President Raphael Bostic noted that the expected jump in inflation will be big but not especially meaningful.
On Friday, the BEA will publish Personal Income, Personal Spending and Personal Consumption Expenditures (PCE) Price Index figures for February.
USD/JPY short-term technical outlook
On the four-hour chart, the Relative Strength Index (RSI) indicator sits around 60, suggesting that USD/JPY has more room on the upside before becoming technically overbought. The first hurdle is located at 109.40 (March high) ahead of 109.70 (June 8, 2020, high) and 110.00 (psychological level).
Supports could be seen at 109.00 (psychological level), 108.60 (50-period SMA) and 108.35 (March 11 low).
Information on these pages contains forward-looking statements that involve risks and uncertainties. Markets and instruments profiled on this page are for informational purposes only and should not in any way come across as a recommendation to buy or sell in these assets. You should do your own thorough research before making any investment decisions. FXStreet does not in any way guarantee that this information is free from mistakes, errors, or material misstatements. It also does not guarantee that this information is of a timely nature. Investing in Open Markets involves a great deal of risk, including the loss of all or a portion of your investment, as well as emotional distress. All risks, losses and costs associated with investing, including total loss of principal, are your responsibility. The views and opinions expressed in this article are those of the authors and do not necessarily reflect the official policy or position of FXStreet nor its advertisers.