Is the S&P 500 at a make or break level?
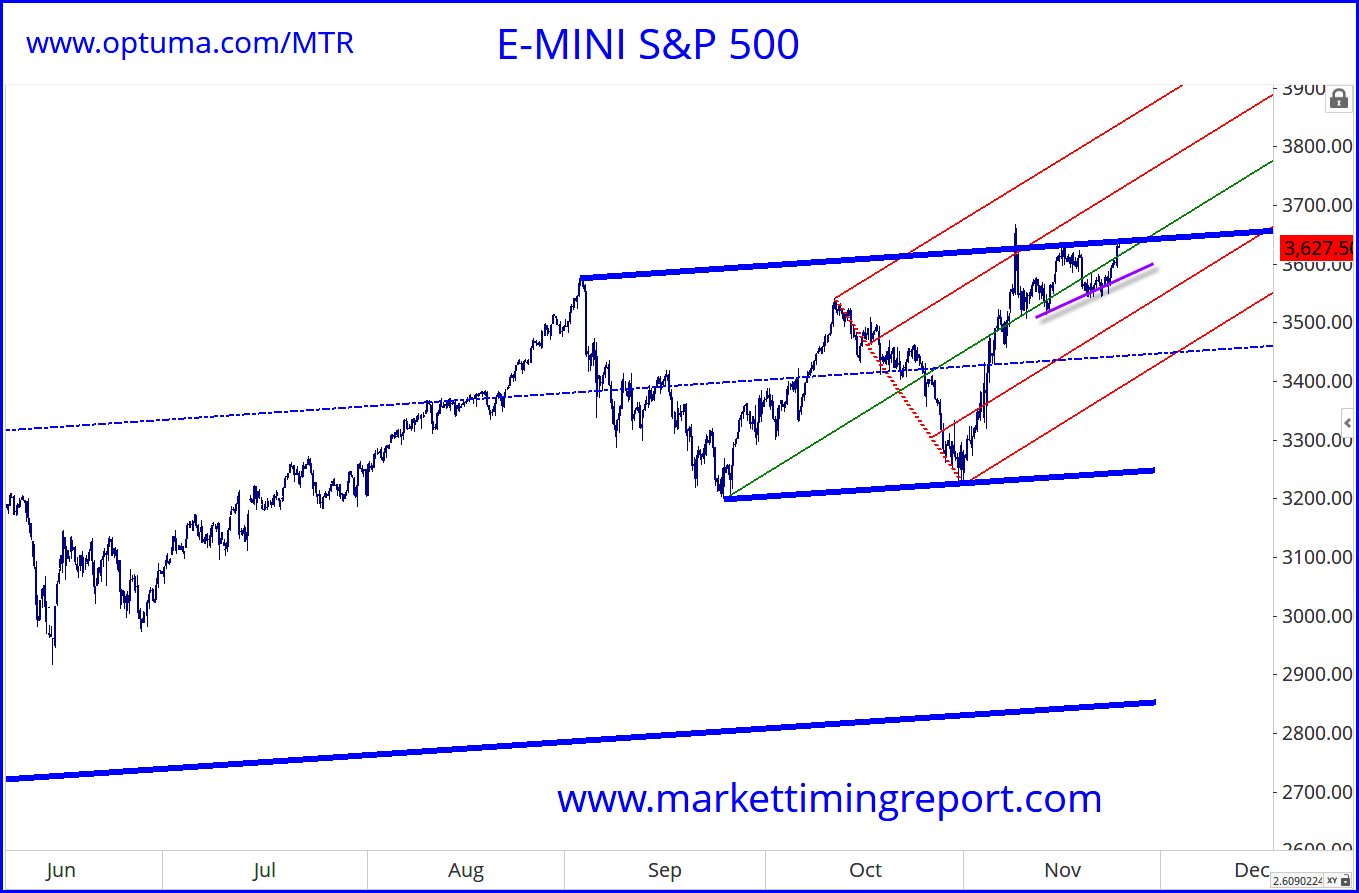
|Take a look at this chart of the S&P500.
You will note that we are up against the thicker upper blue line which is providing resistance.
It is possible that the move could fail here.
However we are seeing a series of higher lows caught by the purple trend line. This is potentially bullish.
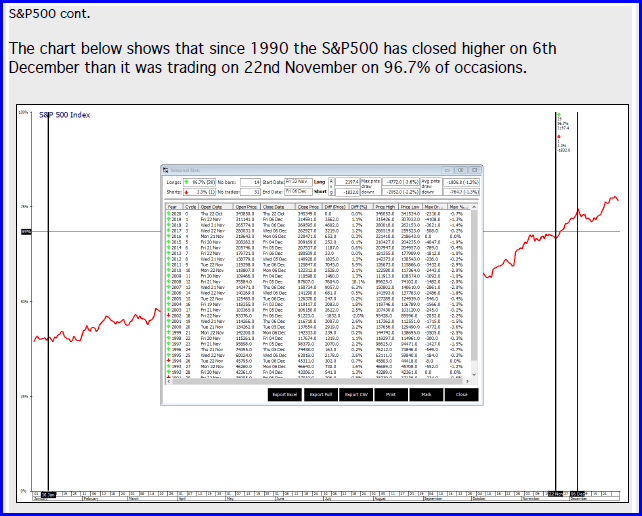
Also, as we published this month, we note that over the last 30 years, the S&P500 Index has closed higher on 6thDecember than it was trading on the 22nd November on 96.7% of occasions.
On the basis of this seasonality it is quite likely that that the index will continue on up through this blue resistance level that is being touched at the time of writing.
Our work also shows that we do see a weekly cycle suggesting a turn as we head into the first week of December. A high is possible towards the end of the first week of December.
Information on these pages contains forward-looking statements that involve risks and uncertainties. Markets and instruments profiled on this page are for informational purposes only and should not in any way come across as a recommendation to buy or sell in these assets. You should do your own thorough research before making any investment decisions. FXStreet does not in any way guarantee that this information is free from mistakes, errors, or material misstatements. It also does not guarantee that this information is of a timely nature. Investing in Open Markets involves a great deal of risk, including the loss of all or a portion of your investment, as well as emotional distress. All risks, losses and costs associated with investing, including total loss of principal, are your responsibility. The views and opinions expressed in this article are those of the authors and do not necessarily reflect the official policy or position of FXStreet nor its advertisers.