GBP/USD path of least resistance is down despite the smiles — Confluence Detector
|GBP/USD is not going anywhere fast after UK PM May met EC President Juncker. Both sides smiled and reported progress ahead of the weekend summit on Brexit. However, the technical picture looks less promising.
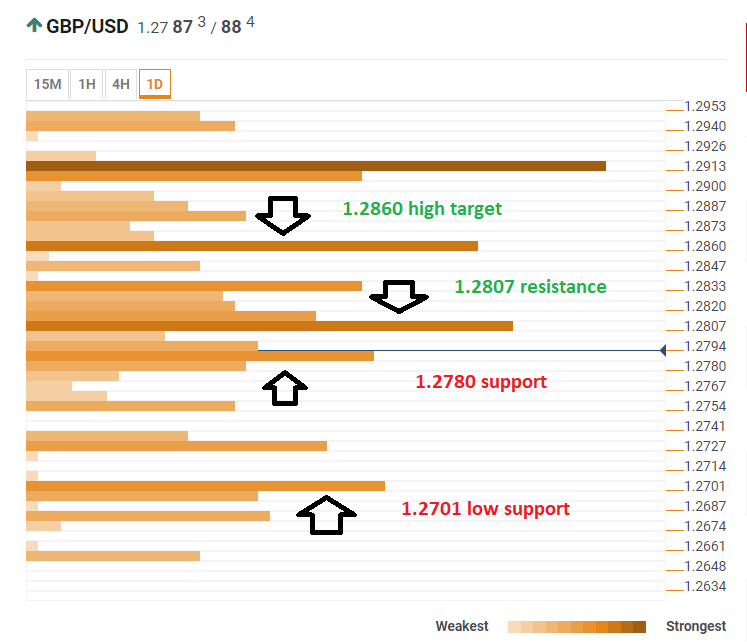
The Technical Confluences Indicator shows that cable faces an uphill battle to recover. 1.2807 is the convergence of the potent Simple Moving Average 200-15m, the SMA 5-one-day, the Bollinger Band 5-one-day, and the Fibonacci 23.6% one-week.
Support at 1.2780 is weaker. It includes the SMA 50-15m, the previous hourly low, the Bollinger Band 15m-Middle, and the BB 1h-Middle, the SMA 5-4h, and the Fibonacci 38.2% one-day.
Losing 1.12780 opens the door to 1.2701 where we see the confluence of the Pivot Point one-week Support 3 and the previous monthly low.
Looking up, overcoming 1.2807 opens the door to 1.2860 which is the meeting point of the Fibonacci 161.8% one-day, the Fibonacci 38.2% one-week, the SMA 200-1h, and the SMA 50-4h.
All in all, resistance clusters are stronger than support ones.
This is how it looks on the tool:
Confluence Detector
The Confluence Detector finds exciting opportunities using Technical Confluences. The TC is a tool to locate and point out those price levels where there is a congestion of indicators, moving averages, Fibonacci levels, Pivot Points, etc. Knowing where these congestion points are located is very useful for the trader, and can be used as a basis for different strategies.
This tool assigns a certain amount of “weight” to each indicator, and this “weight” can influence adjacents price levels. This means that one price level without any indicator or moving average but under the influence of two “strongly weighted” levels accumulate more resistance than their neighbors. In these cases, the tool signals resistance in apparently empty areas.
Information on these pages contains forward-looking statements that involve risks and uncertainties. Markets and instruments profiled on this page are for informational purposes only and should not in any way come across as a recommendation to buy or sell in these assets. You should do your own thorough research before making any investment decisions. FXStreet does not in any way guarantee that this information is free from mistakes, errors, or material misstatements. It also does not guarantee that this information is of a timely nature. Investing in Open Markets involves a great deal of risk, including the loss of all or a portion of your investment, as well as emotional distress. All risks, losses and costs associated with investing, including total loss of principal, are your responsibility. The views and opinions expressed in this article are those of the authors and do not necessarily reflect the official policy or position of FXStreet nor its advertisers.