GBP/USD path of least resistance is down as May loses control — Confluence Detector
|The GBP/USD is trading below 1.3000 once again, amid concerns about Brexit negotiations and the political future of PM Theresa May. What's next?
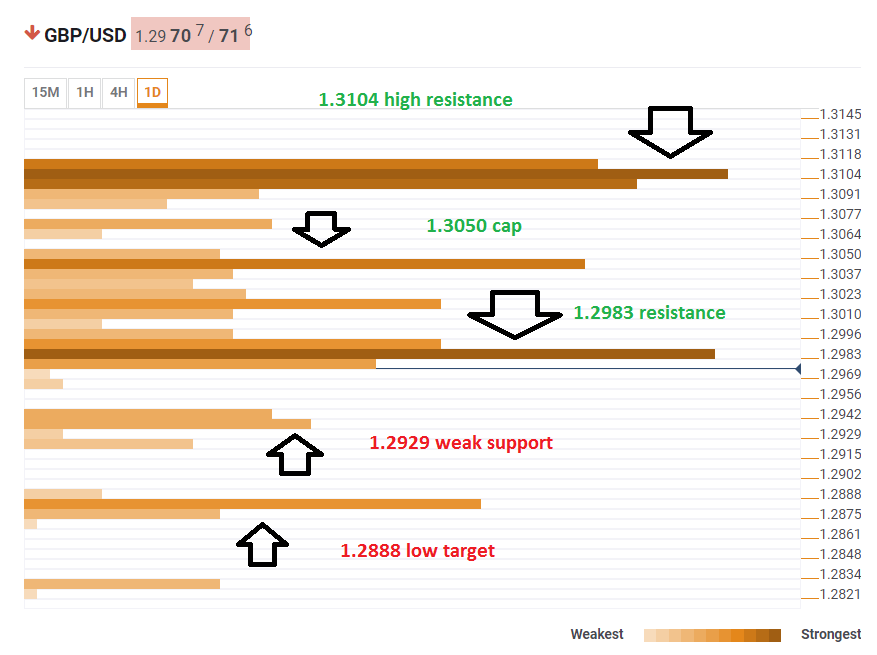
The Technical Confluences Indicator shows that the pair faces fierce resistance at 1.2983. This is the convergence of the Simple Moving Average 5-15m, the Fibonacci 61.8% one-day, the SMA 5-1h, the SMA 10-4h, and the Fibonacci 61.8% one-month.
A break above that cap opens the door to 1.3050 which is the convergence of the Pivot Point one-day Resistance 1 and the one-day high. The most robust resistance is at 1.3104 where we see a dense cluster that consists of the Fibonacci 38.2% one-week, the Fibonacci 38.2% one-month, the SMA 10-one-day, the SMA 50-3h, the Bolinger Band 4h-Upper, the SMA 200-4h, the SMA 200-1h, and the PP one-day Resistance 2.
Looking down, support confluences are few and far apart. 1.2929 is the meeting point of the PP one-day Support 1, the BB 4h-Lower, and the one-day low.
Further below, the 1.2888 level is a more significant cushion where we see the Pivot Point one-week Support 2, the PP one-day S2 and the Fibonacci 161.8% one-day.
The path of least resistance is to the downside.
This is how it looks on the tool:
Confluence Detector
The Confluence Detector finds exciting opportunities using Technical Confluences. The TC is a tool to locate and point out those price levels where there is a congestion of indicators, moving averages, Fibonacci levels, Pivot Points, etc. Knowing where these congestion points are located is very useful for the trader, and can be used as a basis for different strategies.
This tool assigns a certain amount of “weight” to each indicator, and this “weight” can influence adjacents price levels. This means that one price level without any indicator or moving average but under the influence of two “strongly weighted” levels accumulate more resistance than their neighbors. In these cases, the tool signals resistance in apparently empty areas.
Information on these pages contains forward-looking statements that involve risks and uncertainties. Markets and instruments profiled on this page are for informational purposes only and should not in any way come across as a recommendation to buy or sell in these assets. You should do your own thorough research before making any investment decisions. FXStreet does not in any way guarantee that this information is free from mistakes, errors, or material misstatements. It also does not guarantee that this information is of a timely nature. Investing in Open Markets involves a great deal of risk, including the loss of all or a portion of your investment, as well as emotional distress. All risks, losses and costs associated with investing, including total loss of principal, are your responsibility. The views and opinions expressed in this article are those of the authors and do not necessarily reflect the official policy or position of FXStreet nor its advertisers.