$FXY long term cycles and Elliott wave analysis
|Firstly the $FXY instrument inception date was 2/12/2007. The instrument tracks changes of the value of the Japanese Yen versus the US Dollar. There is plenty of data going back into the longer term 1970’s time frame available for the currency cross rate in the USD/JPY. The foreign exchange pair shows a larger degree time frame low is in place October 2011 at 75.57. Comparatively, the FXY instrument reflects a price high at 130.22 in October 2011.
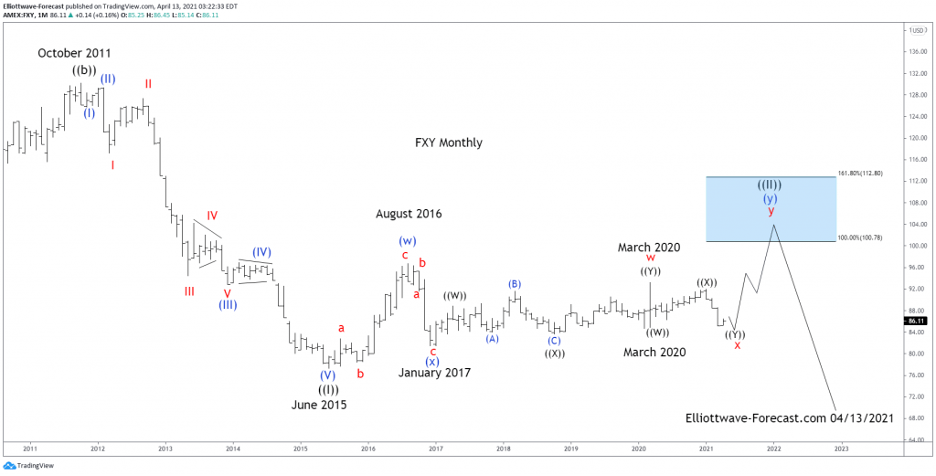
The analysis continues below the FXY Monthly chart.
Secondly the FXY instrument mirrors USD/JPY price highs and lows inversely as the initial above paragraph suggests. In the FXY instrument the decline from the October 2011 high into the June 2015 lows is an Elliott wave impulse. Internally there are a couple of degrees shown there in the red & blue colors that finished the black wave ((I)). From the June 2015 lows the bounce higher in both price and momentum indicators suggested the cycle lower had ended there.
In conclusion: As the FXY weekly chart suggests the instrument ended a larger degree cycle in an Elliott wave impulse of five waves lower in June 2015. The bounce from there appears to be three swings in the wave (w) in blue that ended August 2016. From there a double three wave (x) in blue ended in January 2017. From there a cycle in the red w ended in March 2020.
Currently it appears there is a pullback to correct the cycle from the January 2017 lows before turning higher again in the blue (y) of ((II)). While this plays out with price remaining above the January 2017 lows the FXY can see a turn higher. This larger degree ((II)) is a typical double three Elliott Wave structure. It can reach the 100.78 – 112.80 extension area before the larger degree time frame bearish cycle takes over again taking prices substantially lower.
Information on these pages contains forward-looking statements that involve risks and uncertainties. Markets and instruments profiled on this page are for informational purposes only and should not in any way come across as a recommendation to buy or sell in these assets. You should do your own thorough research before making any investment decisions. FXStreet does not in any way guarantee that this information is free from mistakes, errors, or material misstatements. It also does not guarantee that this information is of a timely nature. Investing in Open Markets involves a great deal of risk, including the loss of all or a portion of your investment, as well as emotional distress. All risks, losses and costs associated with investing, including total loss of principal, are your responsibility. The views and opinions expressed in this article are those of the authors and do not necessarily reflect the official policy or position of FXStreet nor its advertisers.