EUR/USD path of least resistance is up ahead of the NFP – Confluence Detector
|The EUR/USD took baby steps but made its way to the upside, looking hesitant ahead of the all-important US Non-Farm Payrolls. Where next? It may be easier to extend its gains than fall back.
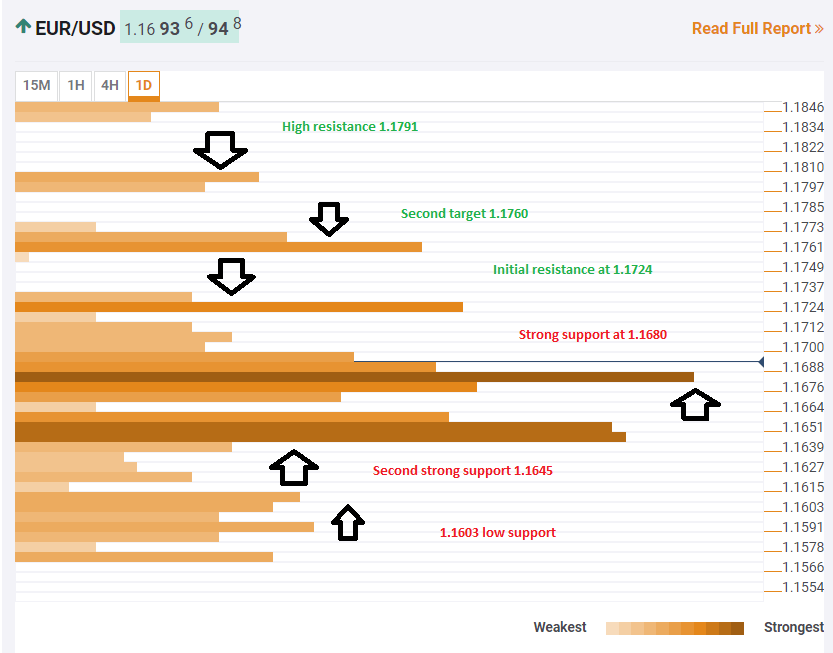
The Technical Confluences Indicator shows that the pair has significant support at 1.1680 which is the congestion of the Bolinger Band 1h-Lower, the Fibonacci 61.8% one-day, the Simple Moving Average 10-4h, the BB 15m-Lower, the Simple Moving Average 200-4h, the SMA 200-15m, the SM 50-1h, and the Fibonacci 23.6% one-week.
Should the pair breach this level of support, the next cushion is quite close, around 1.1645 which is the convergence of the Simple Moving Average 10-one-day, the Fibonacci 38.2% one-week, the one-day high, the Fibonacci 38.2% one-month, the SMA 200-1h, and the SMA 50-4h.
Further below, 1.1603 is another minor line which is the meeting point of the Fibonacci 61.8% one-week and the Fibonacci 161.8% one-day.
On the upside, 1.1725 is the confluence of the Fibonacci 61.8% one-month and the Pivot Point one-day Resistance 1, and it is not as strong as the support lines mentioned earlier.
Higher above, 1.1760 is the meeting point of the Simple Moving Average 50-one-day, the Pivot Point one-day Resistance 2, and the Pivot Point one-week Resistance 1.
Even higher, 1.1791 is the convergence of the Pivot Point one-day Resistance 3 and the Bolinger Band one-day Upper.
Here is how it looks on the tool:
Confluence Detector
The Confluence Detector finds exciting opportunities using Technical Confluences. The TC is a tool to locate and point out those price levels where there is a congestion of indicators, moving averages, Fibonacci levels, Pivot Points, etc. Knowing where these congestion points are located is very useful for the trader, and can be used as a basis for different strategies.
This tool assigns a certain amount of “weight” to each indicator, and this “weight” can influence adjacents price levels. These weightings mean that one price level without any indicator or moving average but under the influence of two “strongly weighted” levels accumulate more resistance than their neighbors. In these cases, the tool signals resistance in apparently empty areas.
Information on these pages contains forward-looking statements that involve risks and uncertainties. Markets and instruments profiled on this page are for informational purposes only and should not in any way come across as a recommendation to buy or sell in these assets. You should do your own thorough research before making any investment decisions. FXStreet does not in any way guarantee that this information is free from mistakes, errors, or material misstatements. It also does not guarantee that this information is of a timely nature. Investing in Open Markets involves a great deal of risk, including the loss of all or a portion of your investment, as well as emotional distress. All risks, losses and costs associated with investing, including total loss of principal, are your responsibility. The views and opinions expressed in this article are those of the authors and do not necessarily reflect the official policy or position of FXStreet nor its advertisers.