AUD/USD is battling very strong resistance after the surge — Confluence Detector
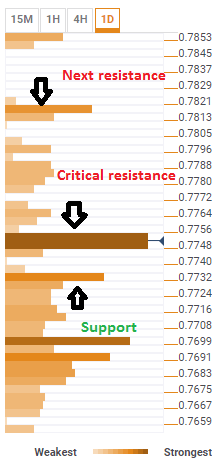
|After the Aussie shot higher, the Technical Confluences Indicator shows that it faces the convergence of several important lines of resistance at A$0.7755. The area is the meeting point of the Fibonacci 28.2% one month, the Pivot Point one-day R2, the SMA200-4h, the 4-hour high, and the SMA10-15 minutes.
A break above this level does not mean a clear path to the upside, but there are no significant clusters until 0.7815, where the 61.8% Fibo level (one month) meets the SMA50 one-day. All the lines in between are of a lower technical grade.
Looking down, a failure to move higher will open the door to the downside. A meaningful confluence of levels awaits around 0.7728: the one-week high, the Bolinger Band 1h-Upper (Stdv. 2.2), the BB 1 day-Middle, the SMA50 15 minutes and the SMA10 one hour.
The move to the upside was inspired by a pledge for openness by Chinese President Xi Jinping and talks about negotiation on trade by Trump's adviser Peter Navarro. The Australian dollar rallied on hopes for improving trade.
Here is how it looks on the tool:
Confluence Detector
The Confluence Detector finds exciting opportunities using Technical Confluences. The TC is a tool to locate and point out those price levels where there is a congestion of indicators, moving averages, Fibonacci levels, Pivot Points, etc. Knowing where these congestion points are located is very useful for the trader, and can be used as a basis for different strategies.
This tool assigns a certain amount of “weight” to each indicator, and this “weight” can influence adjacents price levels. This means that one price level without any indicator or moving average but under the influence of two “strongly weighted” levels accumulate more resistance than their neighbors. In these cases, the tool signals resistance in apparently empty areas.
Information on these pages contains forward-looking statements that involve risks and uncertainties. Markets and instruments profiled on this page are for informational purposes only and should not in any way come across as a recommendation to buy or sell in these assets. You should do your own thorough research before making any investment decisions. FXStreet does not in any way guarantee that this information is free from mistakes, errors, or material misstatements. It also does not guarantee that this information is of a timely nature. Investing in Open Markets involves a great deal of risk, including the loss of all or a portion of your investment, as well as emotional distress. All risks, losses and costs associated with investing, including total loss of principal, are your responsibility. The views and opinions expressed in this article are those of the authors and do not necessarily reflect the official policy or position of FXStreet nor its advertisers.