USD/CNY mid-point set to 6.6123, bears below critical monthly support
|- PBoC set yuan mid-point at 6.6123 / dlr vs last close 6.6079.
- Uncertainties prevail, but USD/CNY technical analysis points to a correction.
USD/CNY has been relentless in its pursuit of lower lows since breaking the April 2020 support structure and the US elections that have weighed heavily on the US dollar has just tipped the pair over the edge.
However, the pace of CNY appreciation following the re-opening of Chinese markets after the Golden Week holidays has already caused a degree of concern among officials.
The risks from here are actually balanced considering the measures for which the People's Bank of China announced recently, such as the lowering of the risk reserves ratio for FX forwards trading (from 20% previously to 0%) as well as reducing the cost of hedging and encourage FX forward sales.
Combined, the measures suggest increased near-term downside risks to CNY as well as more CNY volatility as uncertainty around the US dollar prevails.
''We think China still wants a stable to firm currency as a means to attract inflows and maintain domestic confidence,'' analysts at TD Securities explained.
Meanwhile, the new President Select, Joe Biden, will likely keep his policy on China opaque for some time, keeping markets guessing.
However, analysts at ANZ bank argued that while the China-US relationship will remain uncertain, China will prefer to gradually reduce the exposure of its current and capital accounts to the US dollar.
''The authorities could promote direct conversion between the yuan and other currencies in a number of ways.''
USD/CNY technical analysis
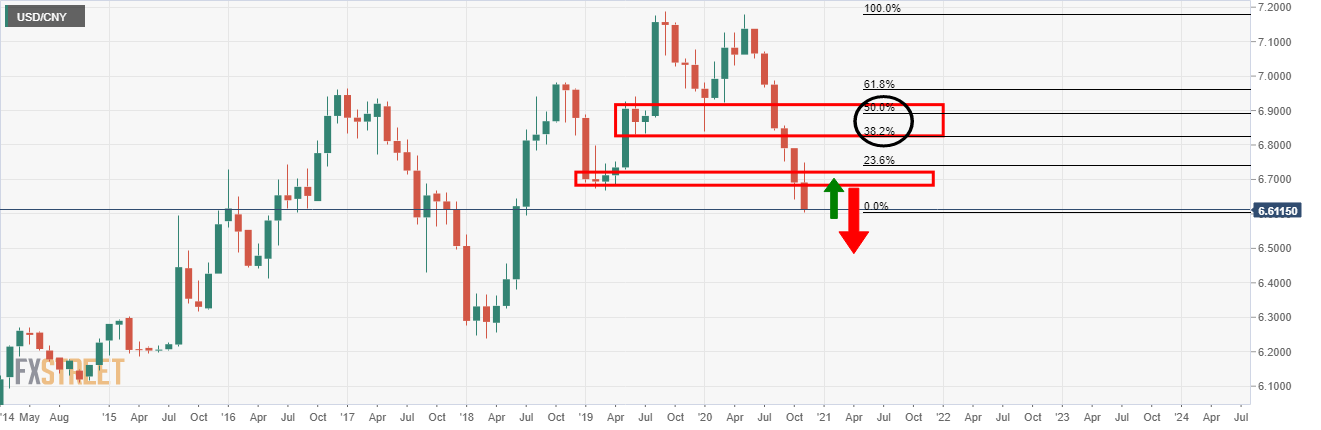
From a technical standpoint, it would be expected that we will see a meaningful correction in the value of USD/CNY considering how many uninterrupted months we have seen the cross deteriorate uninterrupted:
We may see a relatively shallow correction at some point soon as highlighted by the bullish, green arrow.
However, a more meaningful correction would target structure higher up and towards the neckline of the M-formation with, first, the confluence of the 38.2% Fibonacci retracement and a 50% mean reversion thereafter.
From a weekly perspective, a 50% mean reversion correlates with the first resistance structure above.
Meanwhile, from a daily perspective, the 38.2% corresponds well with the late October and prior support structure:
DXY outlook
DXY Price Analysis: Bears in charge eyeing a break of 91 level
Information on these pages contains forward-looking statements that involve risks and uncertainties. Markets and instruments profiled on this page are for informational purposes only and should not in any way come across as a recommendation to buy or sell in these assets. You should do your own thorough research before making any investment decisions. FXStreet does not in any way guarantee that this information is free from mistakes, errors, or material misstatements. It also does not guarantee that this information is of a timely nature. Investing in Open Markets involves a great deal of risk, including the loss of all or a portion of your investment, as well as emotional distress. All risks, losses and costs associated with investing, including total loss of principal, are your responsibility. The views and opinions expressed in this article are those of the authors and do not necessarily reflect the official policy or position of FXStreet nor its advertisers.