Oil Price Analysis: WTI pushes higher
|- API inventories show another massive draw of -8.322mln barrels.
- OPEC+ may temper supply restart with extra oil cuts from cheats.
API weekly data and OPEC+ developments
The latest weekly American Petroleum Institute (API) weekly data shows crude stocks fells -8.322 mln. Inventory at Cushing Oaklahoma increased by 0.548 mln. Gasoline stocks declined by -3.611 mln and distillate stocks produced a build of 3.030 mln.
There has been a slew of comments ahead of the OPEC JMMC meeting on Wednesday with the latest reports suggesting the cartel may keep an 842k barrel per day cut in August and September. This would be considered due to some members who did not fully comply with the OPEC+ cut arrangement. The finalisation of these cuts will be outlined on Wednesday at the JMMC meeting.
Elsewhere here are some of the key headlines from the OPEC report earlier in the session:
- Global oil demand to surge in 2021.
- Non-OPEC supply will be slower to recover:
- OPEC pumped 22.27 million b/d in June.
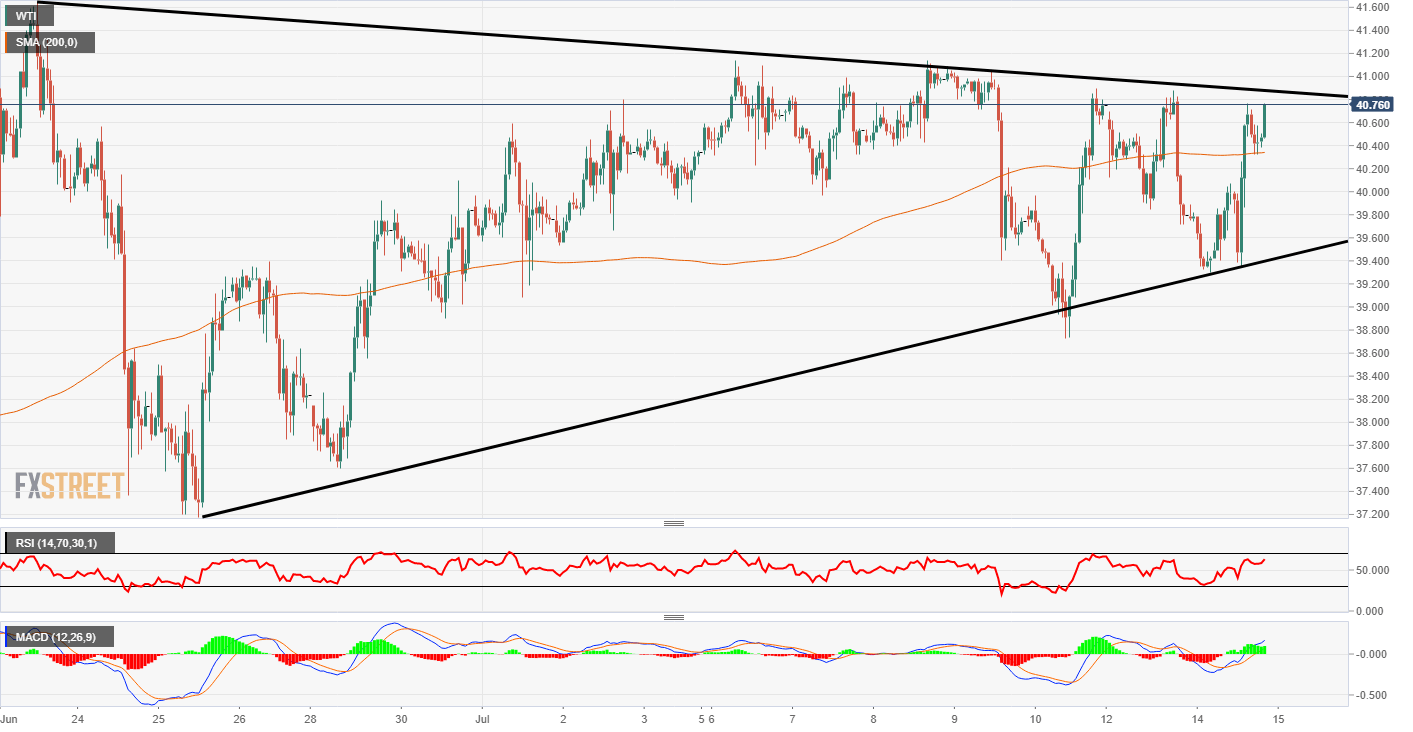
WTI 1-hour chart
In an initial reaction, WTI prices shot up to reach USD 40.19 per barrel on Tuesday. This is a 2.25% increase on the session and interesting as earlier on in the day prices were struggling down at USD 38.70 per barrel. The top of the pattern on the chart below could be tested and if it is broken then the highs at USD 40.39 could be next. That would also mean a break of the recent range highs. Overall it seems this uptrend is still intact for now.
Additional levels
Information on these pages contains forward-looking statements that involve risks and uncertainties. Markets and instruments profiled on this page are for informational purposes only and should not in any way come across as a recommendation to buy or sell in these assets. You should do your own thorough research before making any investment decisions. FXStreet does not in any way guarantee that this information is free from mistakes, errors, or material misstatements. It also does not guarantee that this information is of a timely nature. Investing in Open Markets involves a great deal of risk, including the loss of all or a portion of your investment, as well as emotional distress. All risks, losses and costs associated with investing, including total loss of principal, are your responsibility. The views and opinions expressed in this article are those of the authors and do not necessarily reflect the official policy or position of FXStreet nor its advertisers.