Crude Oil News: WTI stays weak below $57.00
|- WTI sheds nearly 1%, back below the $57.00 mark.
- OPEC+ unlikely to deepen output cuts.
- US-China trade headlines remain in focus.
Prices of the barrel of the American reference for the sweet light crude oil have started the week on the defensive and are trading back in sub-$57.00 levels.
WTI weaker on trade concerns
Prices of the West Texas Intermediate dropped below the $57.00 mark per barrel and trade on the defensive on Monday as traders continue to closely follow the developments from the US-China trade scenario,
In fact, President Trump poured could water on Friday over (exaggerated?) optimism surrounding the ‘Phase One’ deal with China, stressing that there is still no decision on any roll over existing tariffs.
Also weighing down on traders’ mood today, the OPEC+ has practically ruled out deeper oil output cuts at its meeting in December, although the cartel will probably extend further the onging agreement.
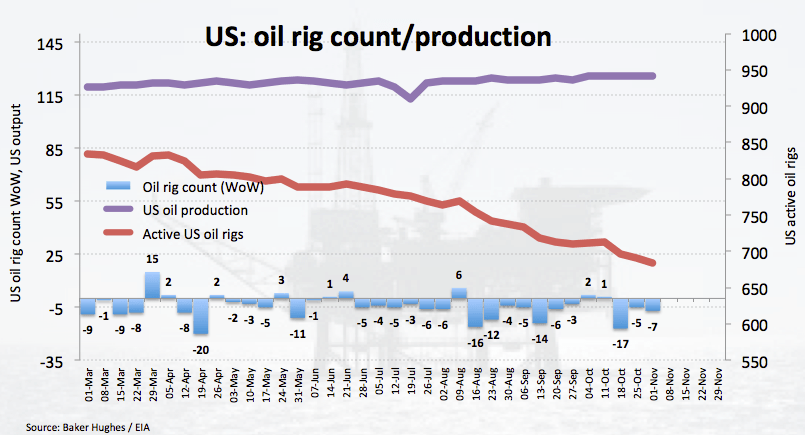
Other news noted driller Baker Hughes reported another down tick in US oil rig count during last week, this time by 7 to 684 active oil rigs.
Later in the week, the usual weekly reports on US crude oil supplies by the API and the EIA are due on Tuesday and Wednesday, respectively.
What to look for around WTI
WTI prices have failed once again to surpass the critical 200-day SMA in the $57.30 region on a sustainable note, leaving last week’s tops at levels just shy of the $58.00 mark per barrel. The US-China trade developments remain the almost exclusive driver of crude oil prices in the near term at least, while speculations continue to gyrate around the probability of removing part of the existing tariffs and the timing of the “Phase One’ deal sign. On the negative side, another significant build in US crude oil supplies have dented the mood among traders in line with downbeat headlines from the OPEC+ event next month.
WTI significant levels
At the moment the barrel of WTI is losing 0.73% at $56.82 and a breakdown of $56.03 (100-day SMA) would expose $55.56 (55-day SMA) and finally $53.71 (low Oct.31). On the upside, the next resistance lines up at $57.50 (monthly high Nov.5) followed by $60.00 (psychological handle) and then $60.94 (monthly high Jul.11).
Information on these pages contains forward-looking statements that involve risks and uncertainties. Markets and instruments profiled on this page are for informational purposes only and should not in any way come across as a recommendation to buy or sell in these assets. You should do your own thorough research before making any investment decisions. FXStreet does not in any way guarantee that this information is free from mistakes, errors, or material misstatements. It also does not guarantee that this information is of a timely nature. Investing in Open Markets involves a great deal of risk, including the loss of all or a portion of your investment, as well as emotional distress. All risks, losses and costs associated with investing, including total loss of principal, are your responsibility. The views and opinions expressed in this article are those of the authors and do not necessarily reflect the official policy or position of FXStreet nor its advertisers.