Trendlines and the Forex Market
|Hello traders! This week’s newsletter will discuss the differences between two different commonly used trend tools, trendlines and moving averages, with an emphasis on trendlines.
As stated in a previous article, moving averages can help traders potentially determine a trend and also possibly get them better prices when they trade. Moving averages can be very helpful, but are also one of the tools that are most commonly misused by novice traders. Another one of my favorite trend following tools is the trendline, let’s take a look!
As usual, I’ll use Investopedia’s definition:
DEFINITION OF ‘TRENDLINE‘
A line that is drawn over pivot highs or under pivot lows to show the prevailing direction of price. Trendlines are a visual representation of support and resistance in any time frame.
Before we jump into some charts, I want to add that we at Online Trading Academy use quality supply zones to sell and quality demand zones to buy-NOT support and resistance. Using trendlines to determine trend and WHICH supply and demand to focus on is what we’ll discuss this week.
Now, there are two basic schools of thought on how to draw in trendlines. The first is to use the ABSOLUTE high and low pivots to draw in your lines. The second, and the one that I personally use, is to look for the lines that have the most touches WITHOUT drawing through candlestick bodies. I don’t mind drawing through candle wicks or tails, but I won’t draw through bodies to determine a valid trendline. These lines are commonly drawn using two pivots (or touches), but it takes at least three touches to validate or confirm the trendline for trading purposes; the more touches the better as far as I’m concerned! If you find a trendline with 5 or more touches, someone with more money than me HAD to be drawing in the same line and trading from it; that many touches can’t be a coincidence, can it?
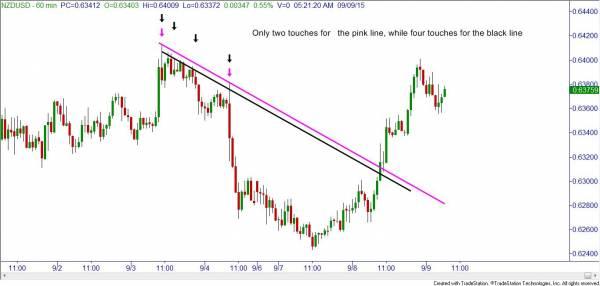
In this NZDUSD chart, the trader using the absolute pivot highs to draw in the downward sloping line only had two touches of the line before price action broke through it. The trader drawing for the most touches while not drawing through candle bodies would have had four touches, giving us a valid line. One of the main reasons I prefer to use the number of touches technique is because with the spot forex market, not everyone sees the exact same pivot highs and low. This is because spot forex is not a centralized market where all trades are reported to one exchange and everyone sees the exact same prices. When looking at these pivot highs and lows, one broker might be a handful of pips off from another broker. The farther forward in time you go, the farther and farther apart their respective trendlines will become. In the futures market, which has a centralized exchange, I use the same technique which so far has worked fine for me.
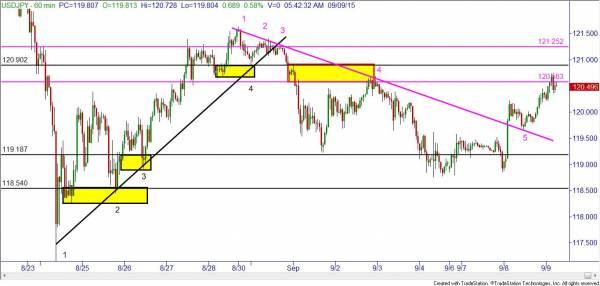
In the following rather convoluted chart, I drew in an upward sloping black trendline with 4 touches and 3 demand zones that could have been used for a long entry. By using the INTERSECTION of a trendline and a demand or supply zone to place trades, very often the trader will be more selective in their trading. As we like to say, we get paid on the quality of our trades, not the quantity. At the touches of the downward sloping pink line, the trader could have entered a short trade at touch marked “4” and also at the touch marked “3.” I didn’t draw in the supply zone at “3” as the chart was getting too messy. You’re welcome. That was one extra tidbit to indicate that the line was drawn correctly. Notice the touch of the pink line at “5?” Whenever I notice a trendline that breaks but then gets touched again coming in from the opposite direction, it “proves” to me that it was a valid trendline. Now, this doesn’t happen every time of course, but it is a nice pat on the back to see that.
Now it’s time for you to do some work. Put your favorite moving averages on the same USDJPY 60 minute chart and scroll back to the same time. Where would your technique have gotten you in? Very often the moving average techniques I see from new traders gets them in much later than this trendline tool.
There are many different ways to use trendlines, these include drawing in channels, triangles, etc. All can be helpful when used in conjunction with our core strategy of buying in demand and selling in supply. These other techniques will be covered in a future newsletter.
Information on these pages contains forward-looking statements that involve risks and uncertainties. Markets and instruments profiled on this page are for informational purposes only and should not in any way come across as a recommendation to buy or sell in these assets. You should do your own thorough research before making any investment decisions. FXStreet does not in any way guarantee that this information is free from mistakes, errors, or material misstatements. It also does not guarantee that this information is of a timely nature. Investing in Open Markets involves a great deal of risk, including the loss of all or a portion of your investment, as well as emotional distress. All risks, losses and costs associated with investing, including total loss of principal, are your responsibility. The views and opinions expressed in this article are those of the authors and do not necessarily reflect the official policy or position of FXStreet nor its advertisers.