Surfing the Waves
|Last week we learned about the basic tenants of Elliott Wave Theory including the wave structure and patterns. This week we will learn how to measure the waves and even some trading strategies that can be used for trading with the waves.
If you recall from the previous article, the waves form in distinct patterns and follow certain rules. In addition to these rules, there are guidelines that allow a trader to estimate the length and time of the waves. These guidelines then offer a trader or investor opportunities to enter positions with a higher probability of success.
Remember that guidelines are not as strong as rules, and prices can and will deviate from these guidelines. The best entries and exits to positions are found with Online Trading Academy’s Core Strategy. The Elliott Wave Theory can be applied as an odds enhancer to your core strategy of identifying strong supply and demand zones.
Last year I discussed the use of Fibonacci retracements and extensions as a means to estimate turning points of both retracements and corrections. These tools can be applied to measuring the impulse and corrective waves and, when they align with a supply or demand zone, can offer the trader the high quality entry and exit points I mentioned.
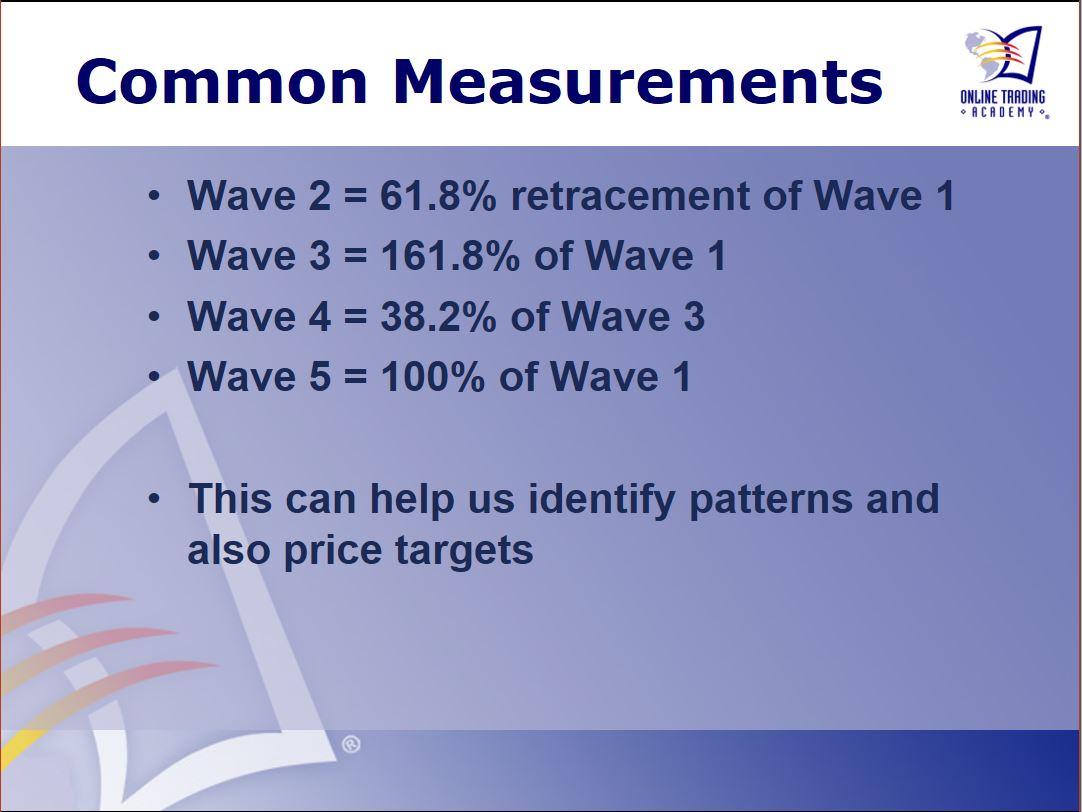
When analyzing the impulsive five wave movements, the most common measurements are:
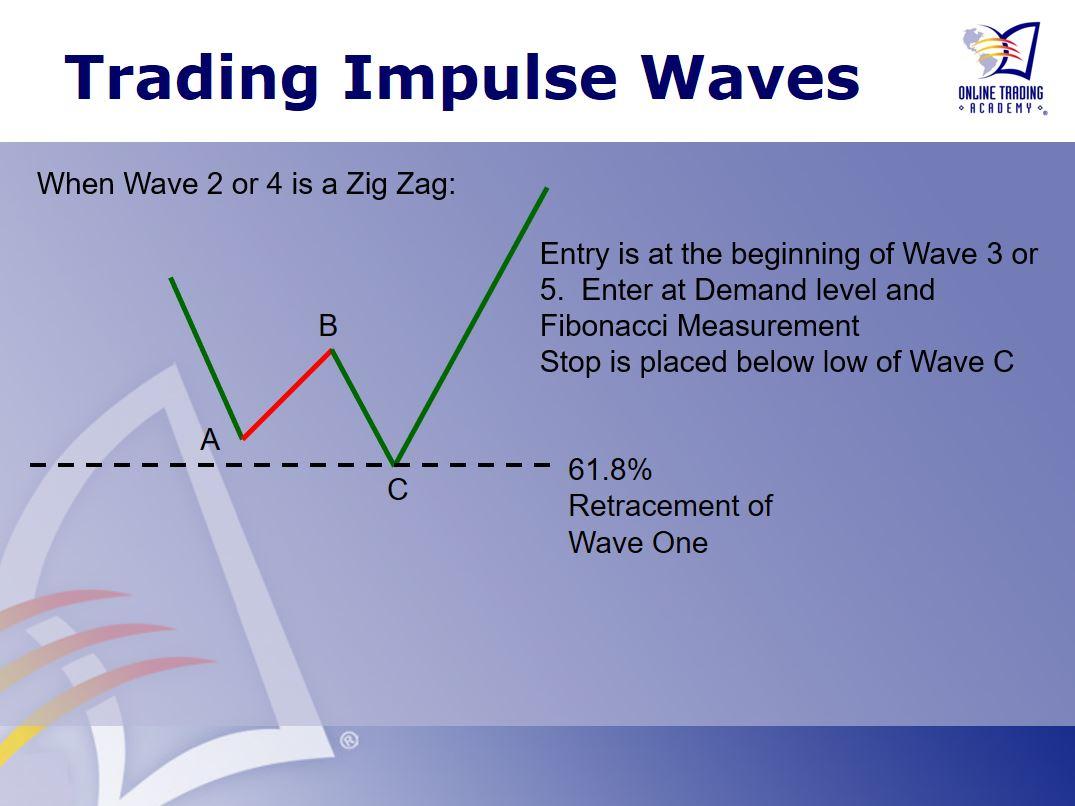
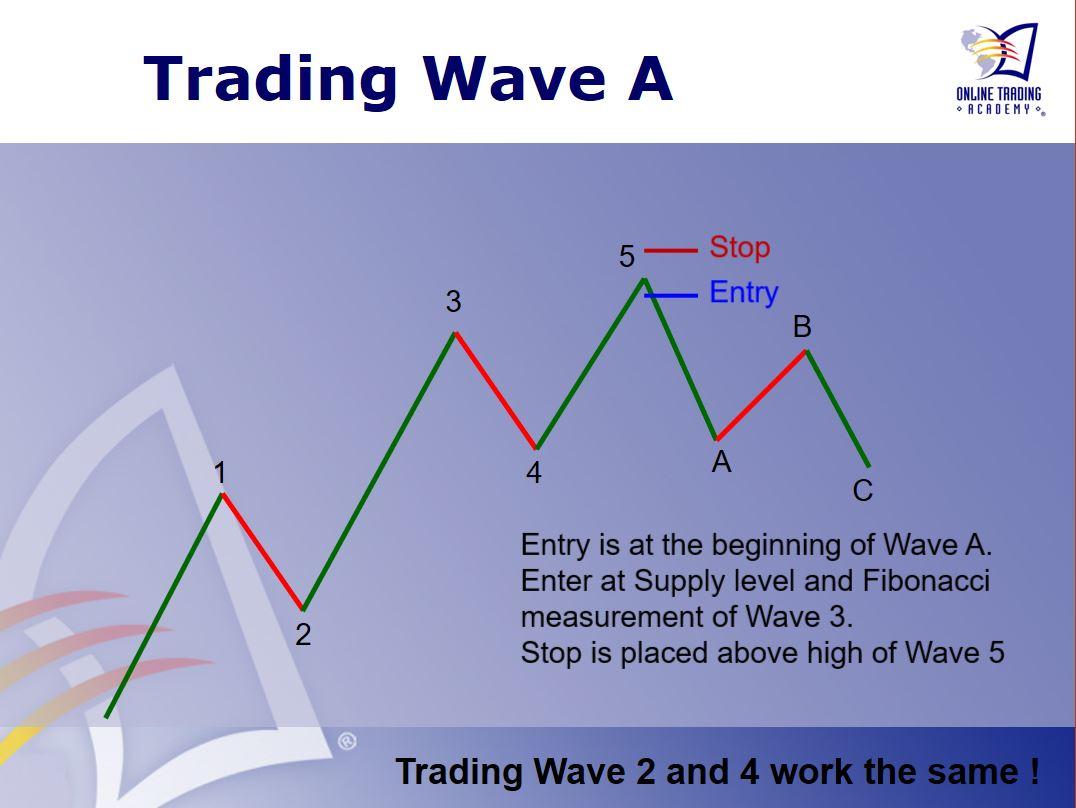
Wave one can be difficult to identify and trade, so when attempting to trade impulses in the larger trend you may have a better chance for success when trading Waves Three or Five. The entry for the position would be at the beginning of Wave Three or Five. This should only be done when there is a strong supply or demand zone that corresponds with the Fibonacci retracement level usually associated with the end of the corrective wave.
When the corrective Wave Two is a zig zag, you would want to enter into the beginning of Wave Three at a demand or supply zone that is at a 61.8% retracement of Wave One. The entry for trading Wave Five would be at a 38.2% retracement of Wave Three.
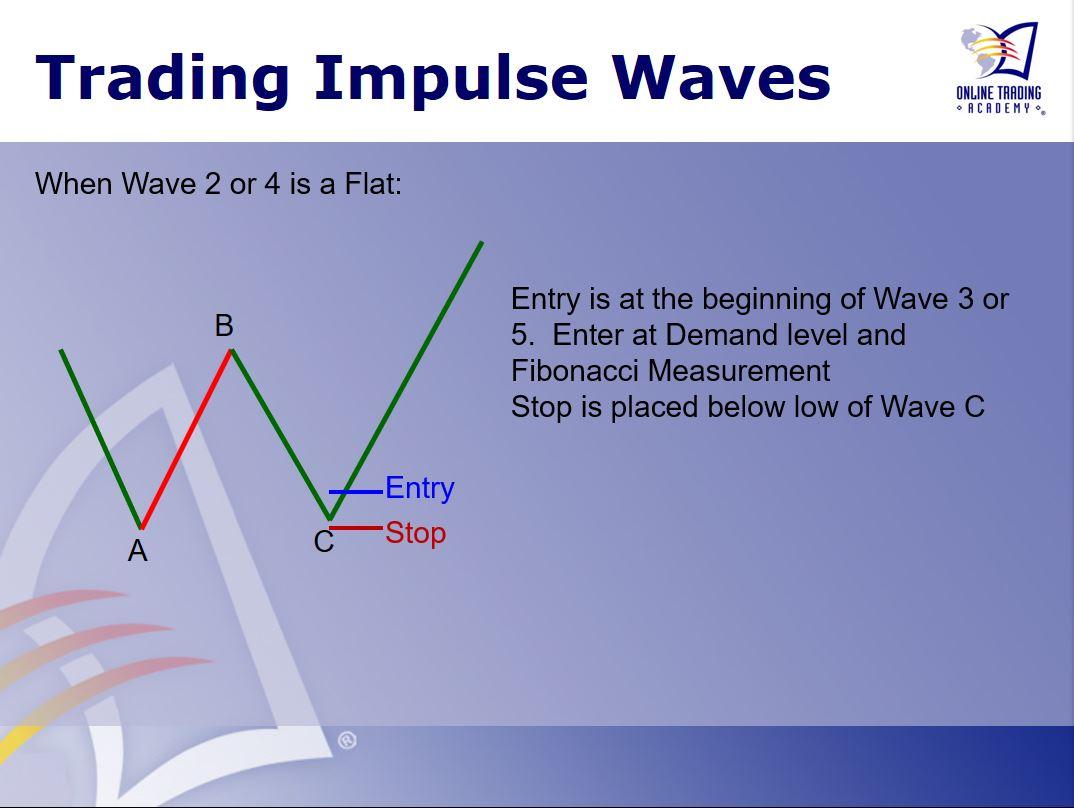
Trading an impulse wave after a flat corrective wave may be easier as the end of Wave A often forms demand or supply for Wave C.
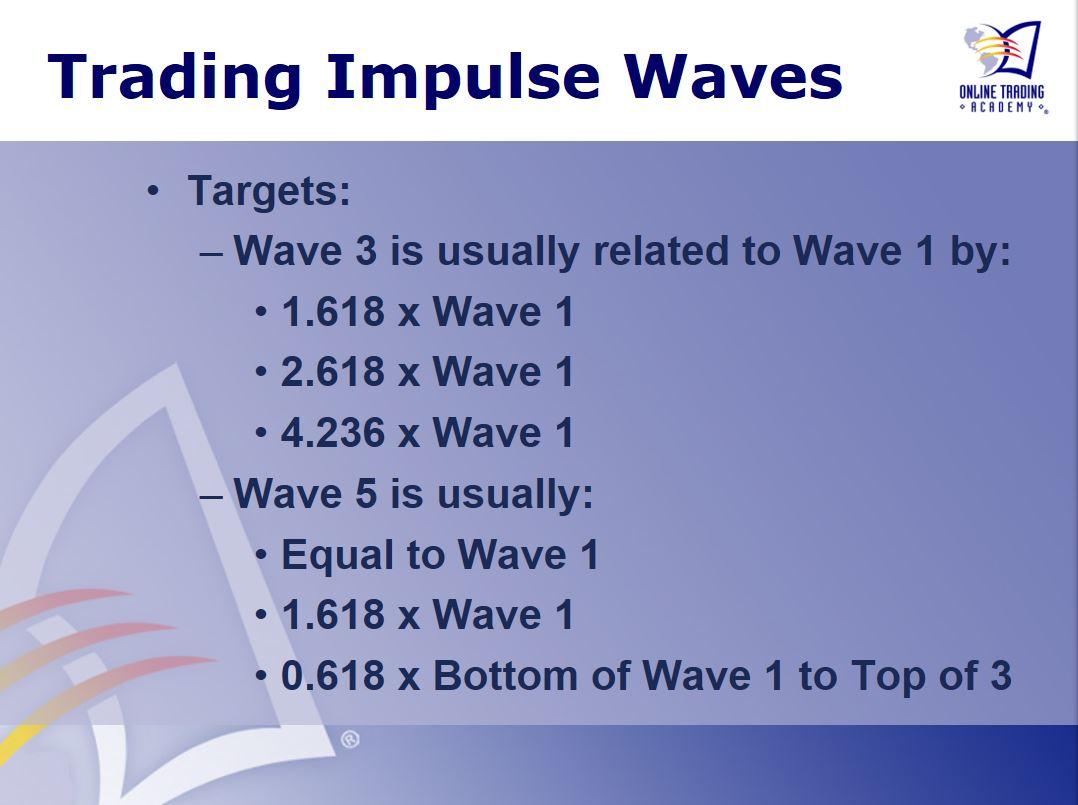
Of course, before you enter a position in the markets you should have also identified your targets. You would target the next opposing supply or demand zone which is where the Fibonacci extensions can help. You can measure the previous impulse waves and see which supply or demand zones line up with the measurements. The most common measurements are below.
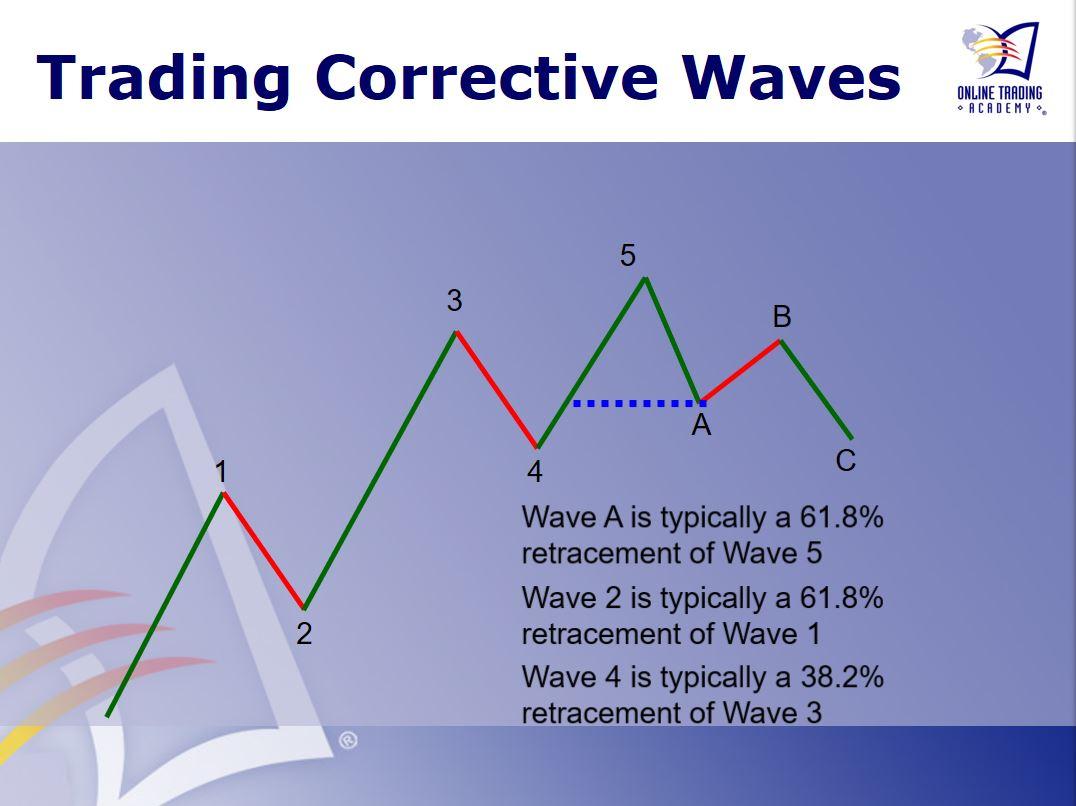
You can also trade the corrective waves. These waves will be smaller and offer lower profits than the impulses but give additional opportunities while waiting for the large impulse moves. Since we know that the impulses are likely to end at a supply or demand level that matches with a Fibonacci measurement, we know our entry for the correction trade. We can enter right at the beginning of those corrections.
The targets would be the opposing supply or demand zone that corresponds to a Fibonacci retracement level. The most common targets are below.
Now that we have an idea of how the entries and exits are identified, let’s look at the markets and see how we can put Elliott Wave Theory to use.
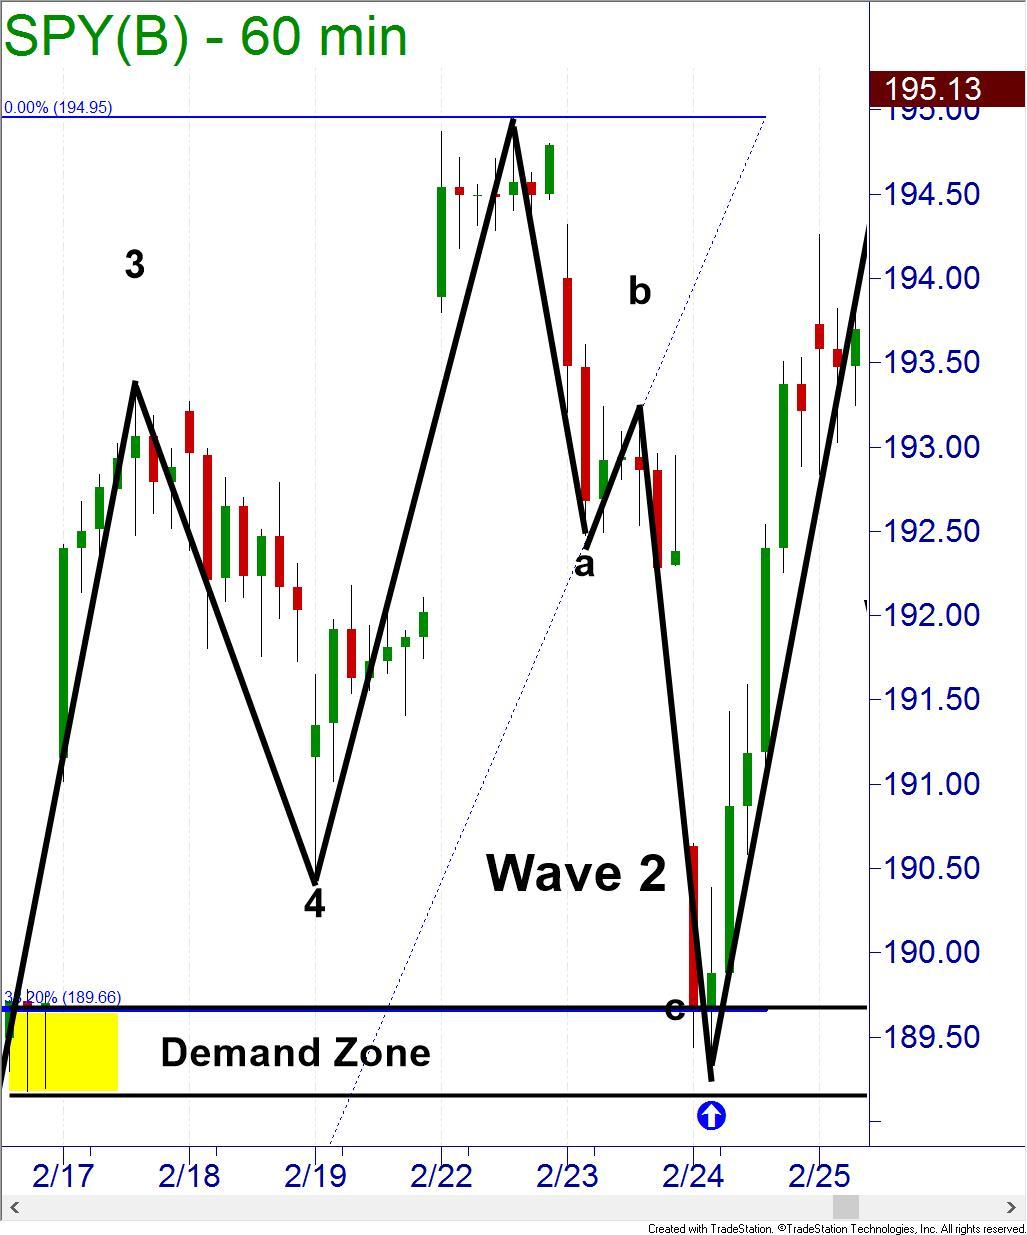
In the 60-minute chart of SPY, you can see wave one, wave two and the start of wave three. The sub waves have also been marked. A trader looking for a long opportunity was able to enter at the point where price pulled back in wave two, to a point where it had both retraced 38.2% of wave one and also a fresh demand zone.
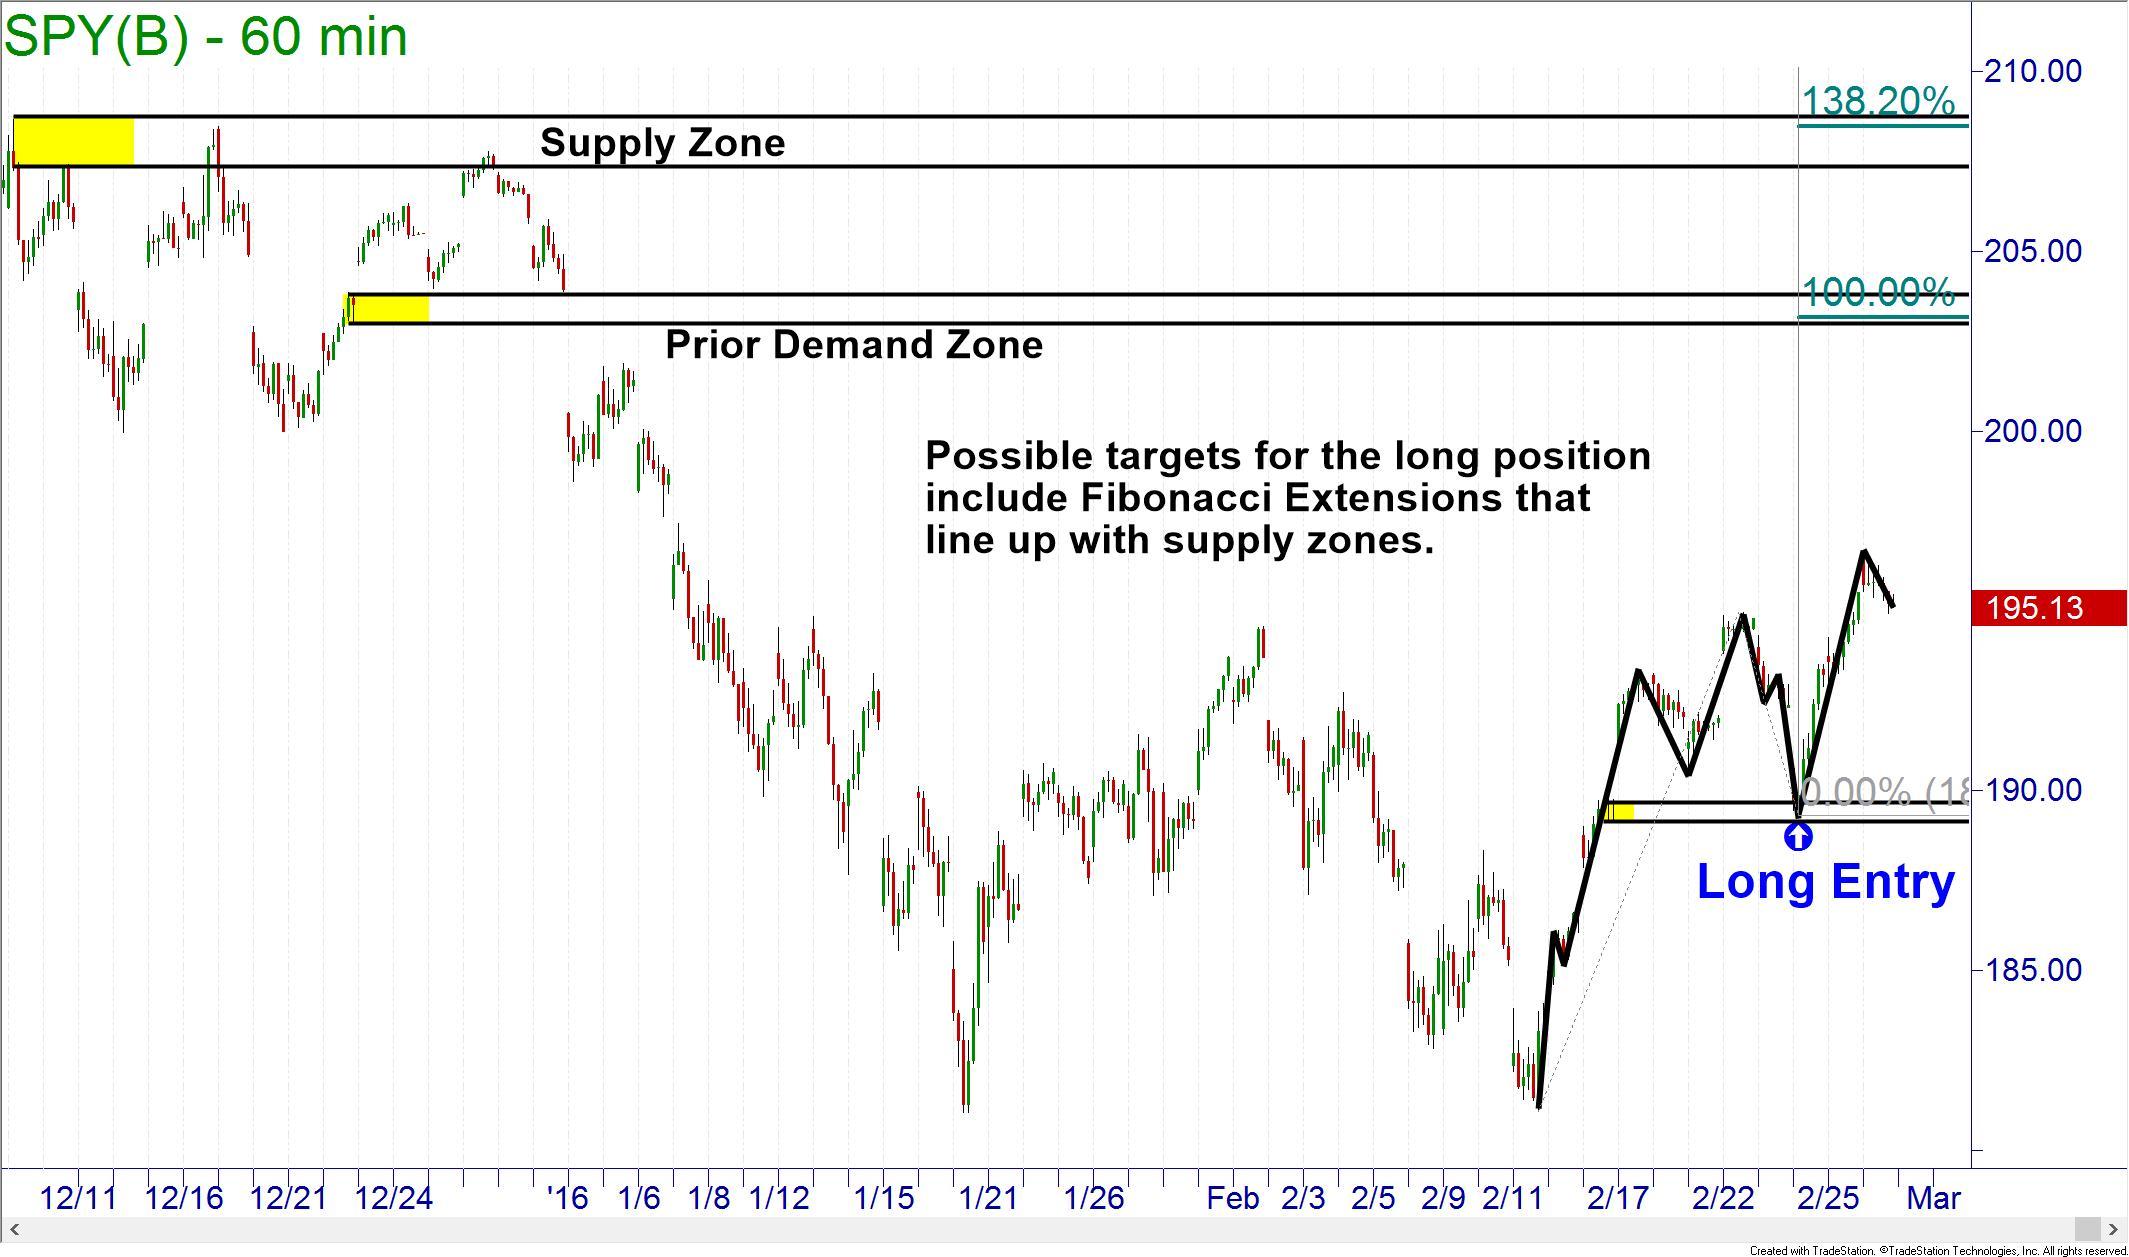
The target for the trade would need to be identified prior to entry into the position. Potential targets for the long trade would be where Fibonacci Extensions line up with supply zones. Note that this will only mark the end of wave three, not the end of the trend. The trader could lock in profits at the beginning of the wave four correction and then re-enter for wave five.
Elliott Wave Theory can be useful in order to increase your chances for success in your trading. Notice that it can only help increase chances; in order to know where the best entry and exit points are in any market you should apply Online Trading Academy’s core strategy. To learn these valuable tools, visit your local center today.
Information on these pages contains forward-looking statements that involve risks and uncertainties. Markets and instruments profiled on this page are for informational purposes only and should not in any way come across as a recommendation to buy or sell in these assets. You should do your own thorough research before making any investment decisions. FXStreet does not in any way guarantee that this information is free from mistakes, errors, or material misstatements. It also does not guarantee that this information is of a timely nature. Investing in Open Markets involves a great deal of risk, including the loss of all or a portion of your investment, as well as emotional distress. All risks, losses and costs associated with investing, including total loss of principal, are your responsibility. The views and opinions expressed in this article are those of the authors and do not necessarily reflect the official policy or position of FXStreet nor its advertisers.