XRP/USD technical analysis: XRP runs into a brick wall at 0.2850
|- XRP/USD trades 1.34% lower and has hit a strong resistance zone at 0.2850.
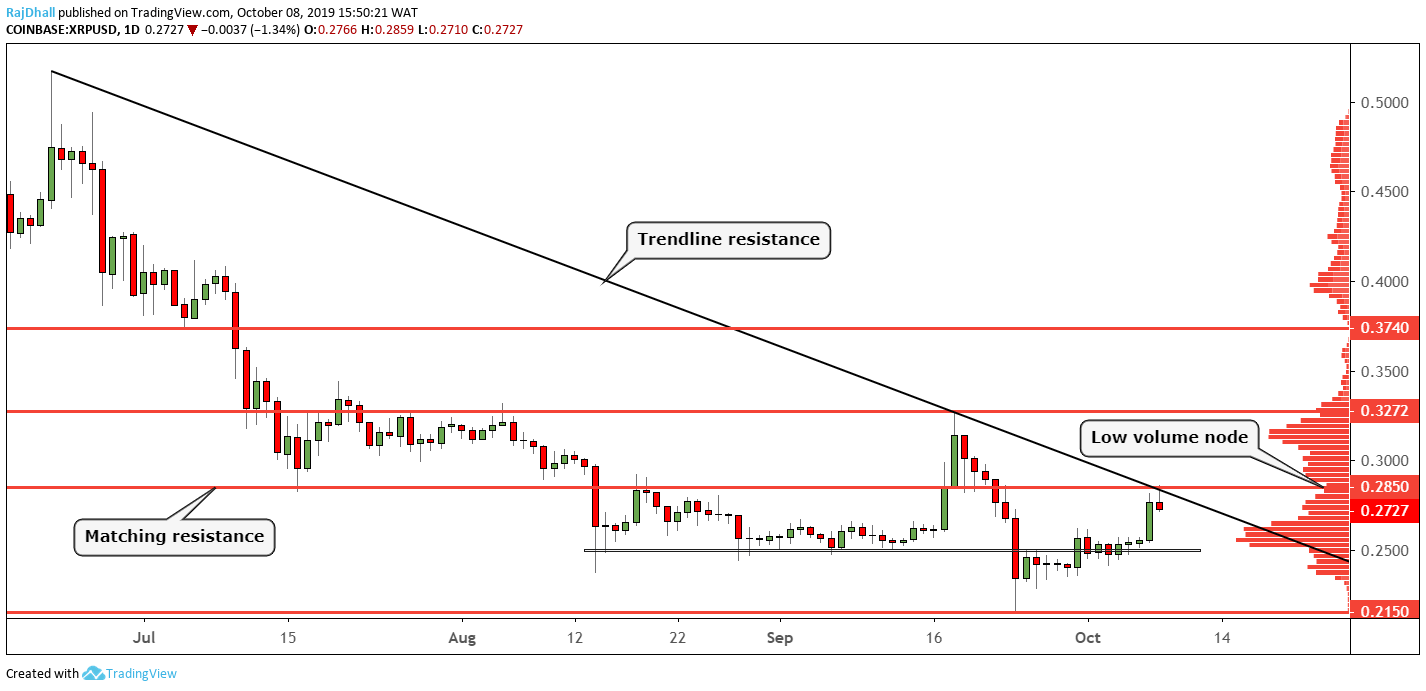
- There is also a trendline resistance zone at the same area which has halted any progress.
Technical analysis works amazingly on the crypto markets. On the daily chart below you can see there is a trendline that originated in June.
Today the price hit the trendline and bounced right off as it seemed to hold as a strong resistance point.
Incidentally, there is also a horizontal resistance line at 0.2850 that has used a few times in the past.
On the downside, if the bears regain control 0.2500 could come into focus once more.
If the trend is to change and move higher the level the bulls need to take out is 0.3272. On the volume profile indicator on the right-hand side of the chart, we are currently above the mean value area. This is represented by the bell curve with the biggest peak which is around 0.2560.
Information on these pages contains forward-looking statements that involve risks and uncertainties. Markets and instruments profiled on this page are for informational purposes only and should not in any way come across as a recommendation to buy or sell in these assets. You should do your own thorough research before making any investment decisions. FXStreet does not in any way guarantee that this information is free from mistakes, errors, or material misstatements. It also does not guarantee that this information is of a timely nature. Investing in Open Markets involves a great deal of risk, including the loss of all or a portion of your investment, as well as emotional distress. All risks, losses and costs associated with investing, including total loss of principal, are your responsibility. The views and opinions expressed in this article are those of the authors and do not necessarily reflect the official policy or position of FXStreet nor its advertisers.