XRP/USD Technical Analysis: Ripple breaks higher but can it sustain the move?
|- Ripple trades 2.4% higher today as general crypto sentiment improves across the board.
- The price has currently broken through the resistance level of 0.2255 but it needs a close to confirm.
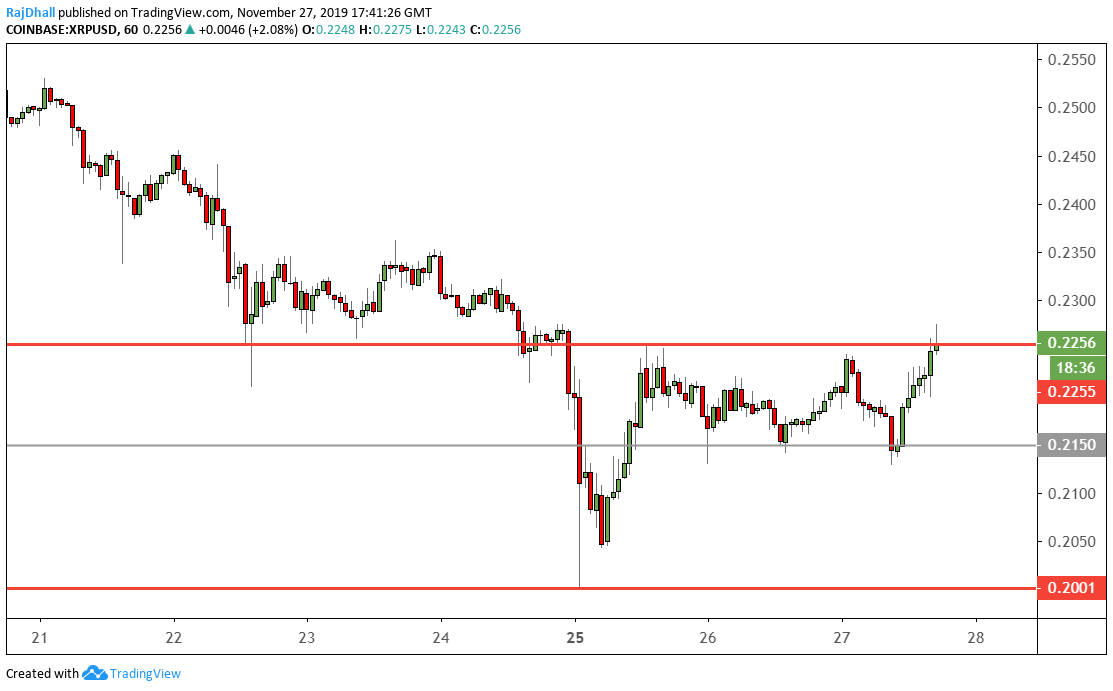
Ripple Hourly Price Chart
As you can see from the chart below the price has recently shot higher.
The 0.2255 level has been used on a number of occasions as a support and resistance level.
The next potential resistance lies at 0.2355 which has been respected on three occasions.
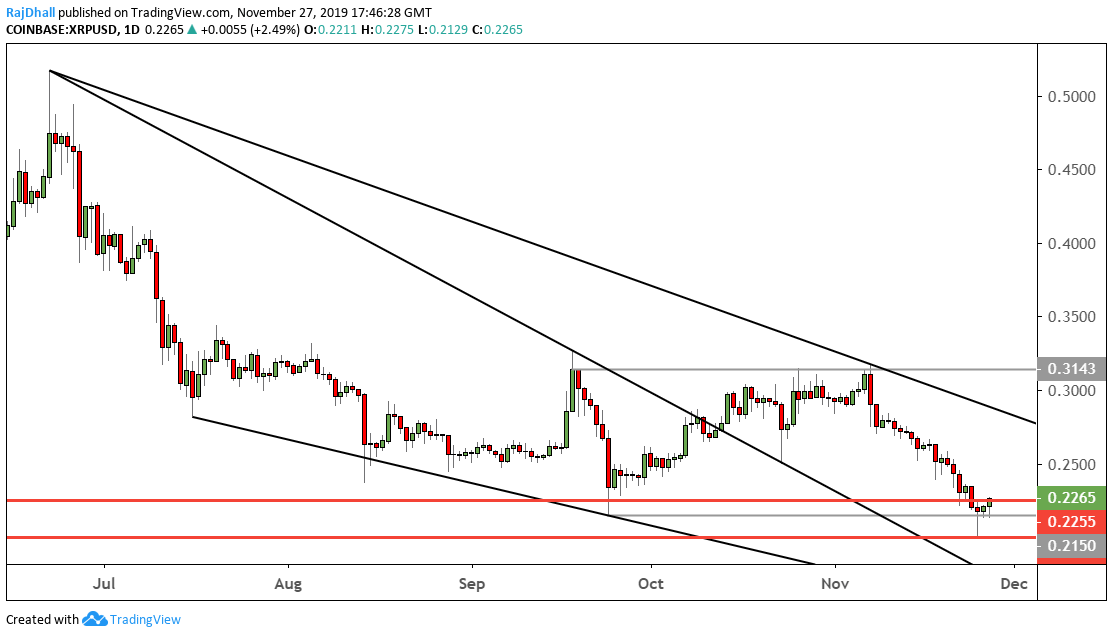
Ripple Daily Chart
The daily chart still looks under some serious pressure.
Although the lower timeframes have shown a bullish breakout the psychological 0.25 would be the level to beat on the higher timeframe.
Longer term the channel high is the main target for the bulls as the hammer candle two days ago provided a bullish signal.
Information on these pages contains forward-looking statements that involve risks and uncertainties. Markets and instruments profiled on this page are for informational purposes only and should not in any way come across as a recommendation to buy or sell in these assets. You should do your own thorough research before making any investment decisions. FXStreet does not in any way guarantee that this information is free from mistakes, errors, or material misstatements. It also does not guarantee that this information is of a timely nature. Investing in Open Markets involves a great deal of risk, including the loss of all or a portion of your investment, as well as emotional distress. All risks, losses and costs associated with investing, including total loss of principal, are your responsibility. The views and opinions expressed in this article are those of the authors and do not necessarily reflect the official policy or position of FXStreet nor its advertisers.