Verge Technical Analysis: XVG/USD is down 40% since its 2020 peak at $0.0098
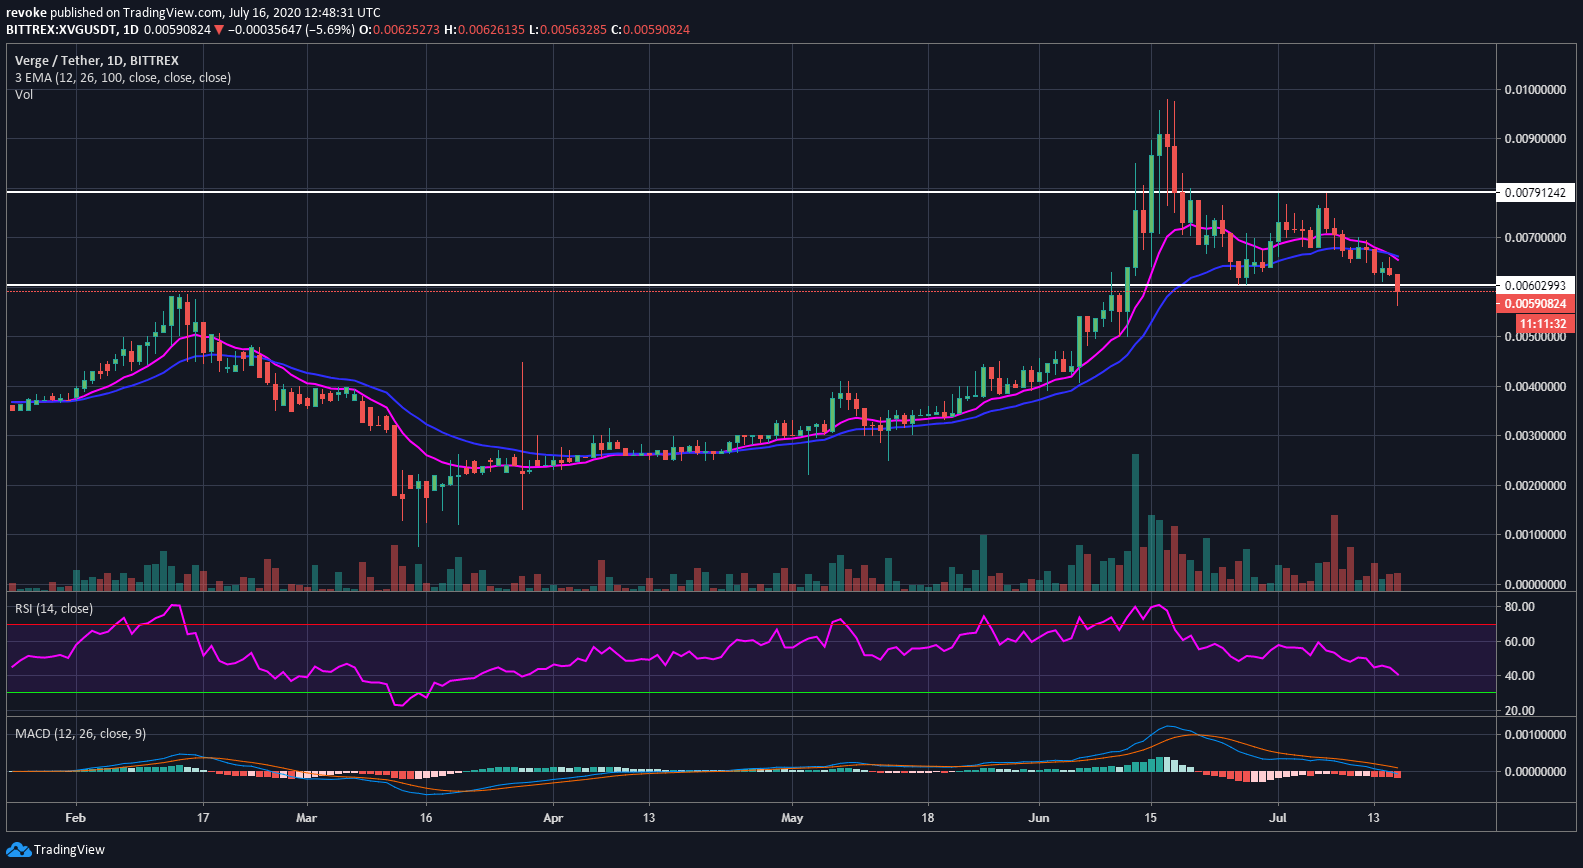
|- Verge price is currently at $0.0059 after a significant pullback.
- The daily chart is now in a downtrend and extremely weak.
Verge has finally succumbed to the selling pressure caused by the huge bull rally towards $0.01. Unfortunately, XVG lost the daily uptrend and has dropped below both daily EMAs which have crossed bearishly for the first time since February 2020.
XVG/USD daily chart
As mentioned above, the daily chart is in a downtrend and bulls don’t have many support levels nearby. The next support point is located at $0.005 but the daily RSI might reach oversold levels before that. The last time we saw the daily RSI being oversold was on March 13 when Verge price bounced significantly.
Information on these pages contains forward-looking statements that involve risks and uncertainties. Markets and instruments profiled on this page are for informational purposes only and should not in any way come across as a recommendation to buy or sell in these assets. You should do your own thorough research before making any investment decisions. FXStreet does not in any way guarantee that this information is free from mistakes, errors, or material misstatements. It also does not guarantee that this information is of a timely nature. Investing in Open Markets involves a great deal of risk, including the loss of all or a portion of your investment, as well as emotional distress. All risks, losses and costs associated with investing, including total loss of principal, are your responsibility. The views and opinions expressed in this article are those of the authors and do not necessarily reflect the official policy or position of FXStreet nor its advertisers.