Stratis Technical Analysis: STRAT/USD massive 57% bull run may continue until $1
|- STRAT/USD is up 13% in the last 24 hours after an extended bull rally.
- The daily uptrend is robust with increasing bullish volume in the past three days.
Stratis has been going up since March 12 hitting a 500% price increase after peaking at $0.71. The last seven days have all been green for STRAT without any sort of consolidation or pullback. The RSI is overextended but FOMO could continue pushing the digital asset to new highs.
STRAT/USD daily chart
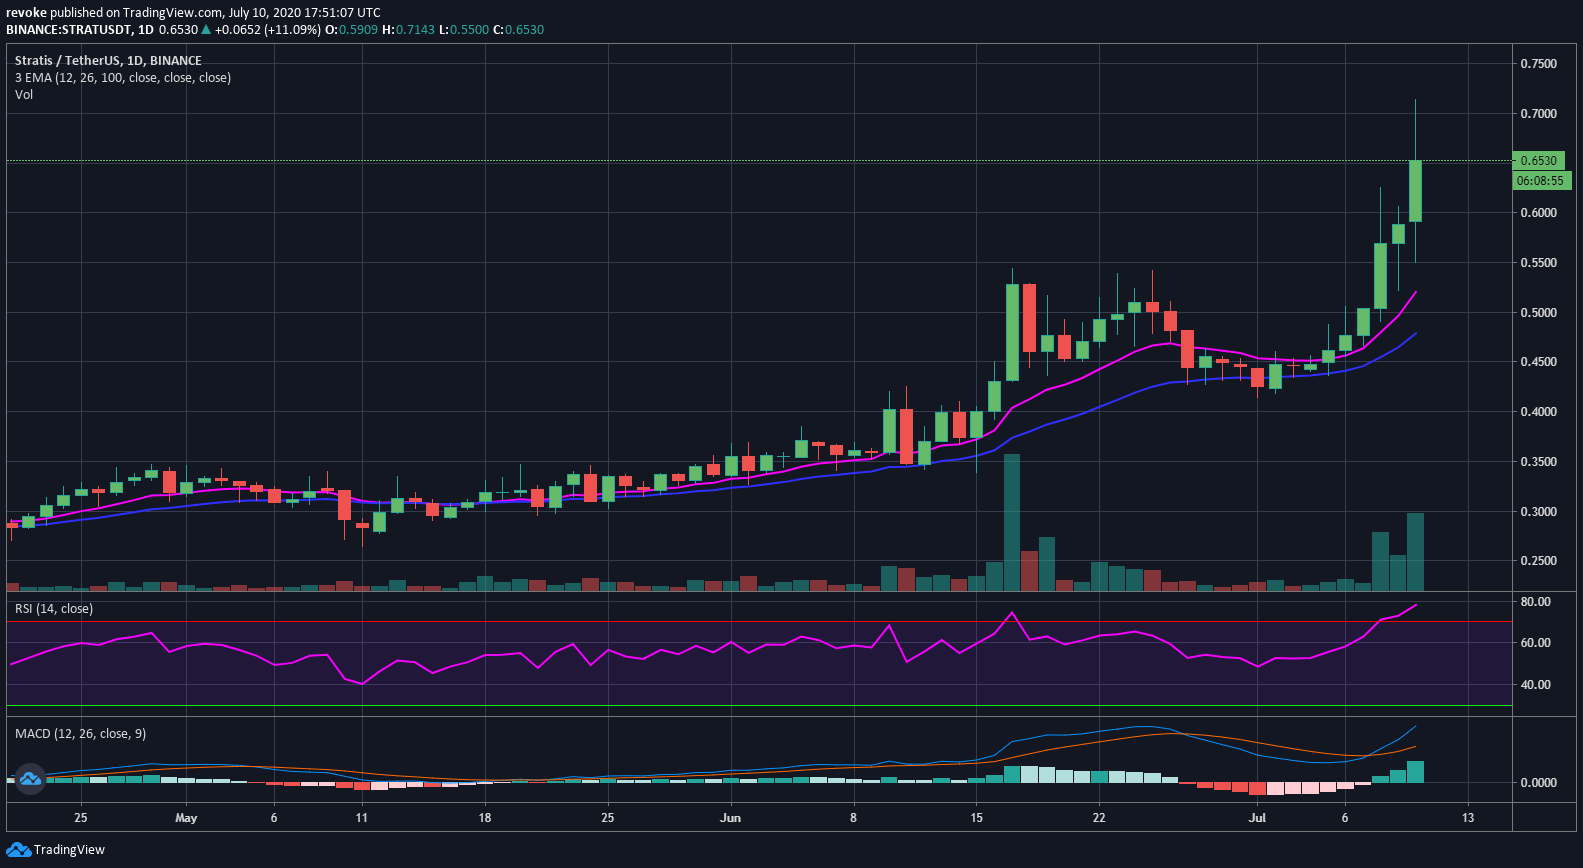
The daily chart is obviously in an uptrend with bulls dominating bears but an overextended RSI which could indicate a pullback is nearby. The MACD crossed bullish only three days ago. The daily 12-EMA at $0.52 is the only support level on the way down, followed by the 26-EMA at $0.47 and the low at $0.414.
Information on these pages contains forward-looking statements that involve risks and uncertainties. Markets and instruments profiled on this page are for informational purposes only and should not in any way come across as a recommendation to buy or sell in these assets. You should do your own thorough research before making any investment decisions. FXStreet does not in any way guarantee that this information is free from mistakes, errors, or material misstatements. It also does not guarantee that this information is of a timely nature. Investing in Open Markets involves a great deal of risk, including the loss of all or a portion of your investment, as well as emotional distress. All risks, losses and costs associated with investing, including total loss of principal, are your responsibility. The views and opinions expressed in this article are those of the authors and do not necessarily reflect the official policy or position of FXStreet nor its advertisers.