Stellar Technical Analysis: XLM/USD at risk of dropping facing strong resistance ahead
|- XLM/USD has dropped 11% in the past 24 hours after an overall market weakness.
- A cluster of indicators is showing that XLM is facing a strong resistance area in the short-term.
Stellar is currently trading at $0.091 after losing the daily uptrend. There has been a clear shift in momentum for the bears which are now in control and facing almost no support levels on the way down.
XLM/USD 12-hour chart
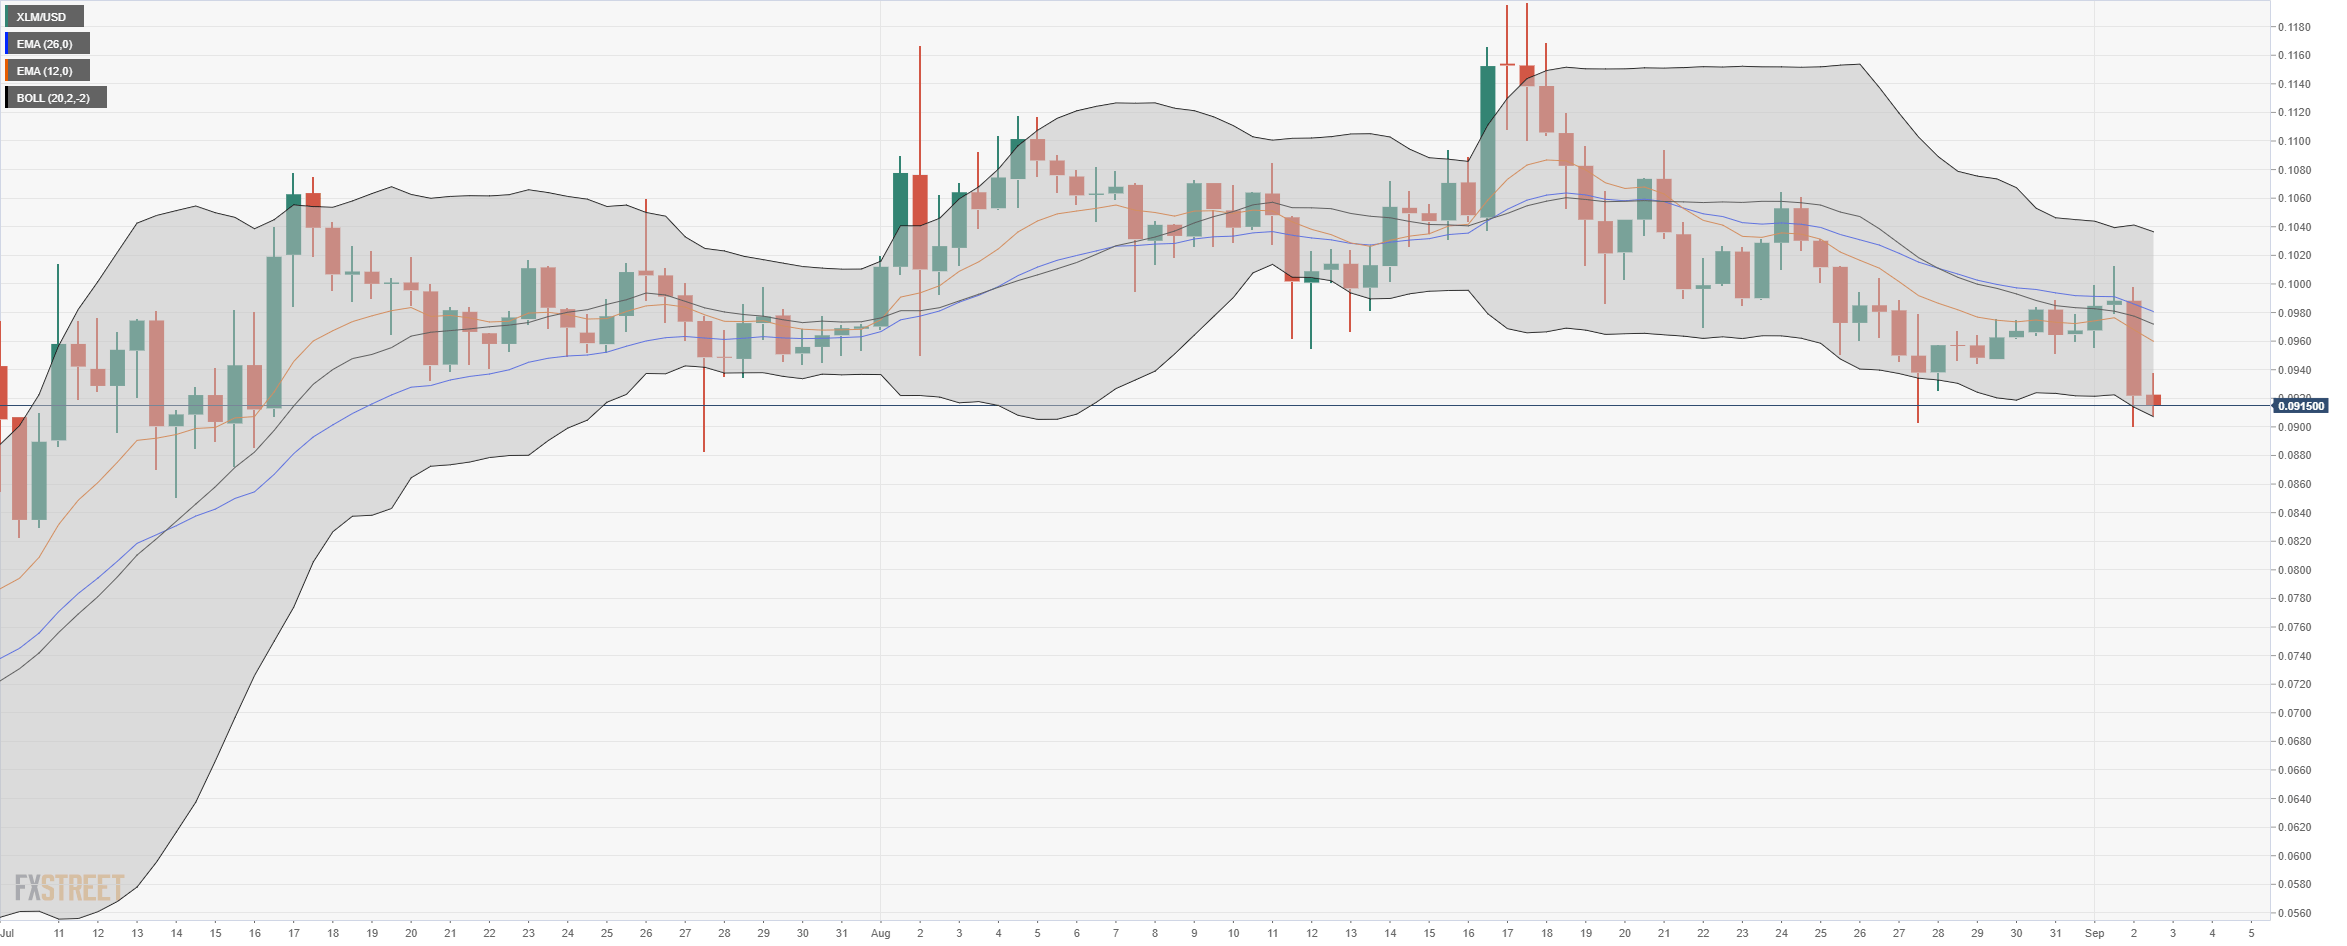
There is a huge area of resistance present above $0.096 from the EMAs and the upper band of the Bollinger indicator. The price was already rejected from $0.1 following the recent news of Bithumb’s fraud charges and seizure of its headquarters.
Bulls are currently trying to defend the lower band and we could see a bounce in the short-term, however, the overall selling pressure will continue existing.
Information on these pages contains forward-looking statements that involve risks and uncertainties. Markets and instruments profiled on this page are for informational purposes only and should not in any way come across as a recommendation to buy or sell in these assets. You should do your own thorough research before making any investment decisions. FXStreet does not in any way guarantee that this information is free from mistakes, errors, or material misstatements. It also does not guarantee that this information is of a timely nature. Investing in Open Markets involves a great deal of risk, including the loss of all or a portion of your investment, as well as emotional distress. All risks, losses and costs associated with investing, including total loss of principal, are your responsibility. The views and opinions expressed in this article are those of the authors and do not necessarily reflect the official policy or position of FXStreet nor its advertisers.