Stellar Price Prediction: XLM facing a potential pullback in the short-term
|- XLM is trading at $0.0762 and faces steep resistance ahead.
- Several indicators are showing XLM could be on the verge of a pullback.
Stellar gained around $230 million in market capitalization over the past week after a significant bull move from $0.07 to a peak of $0.079 on October 12. It seems that XLM could be facing some short-term resistance, according to numerous indicators.
XLM gets ready for a pullback
On the daily chart, we can observe several indicators turning against XLM. First of all, we have the moving averages, the 50-SMA at $0.0797 is acting as a healthy resistance level. Similarly, the 200-SMA has acted as a resistance point for several days in the past and has just rejected the price again.
XLM/USD daily chart
Perhaps the most concerning sign is the TD sequential indicator, which has presented a sell signal on the daily chart. The last time it flashed this signal, the price of XLM dropped 28% within the next three weeks. A similar drop would take XLM down to $0.054. However, there is a support level above at $0.067.
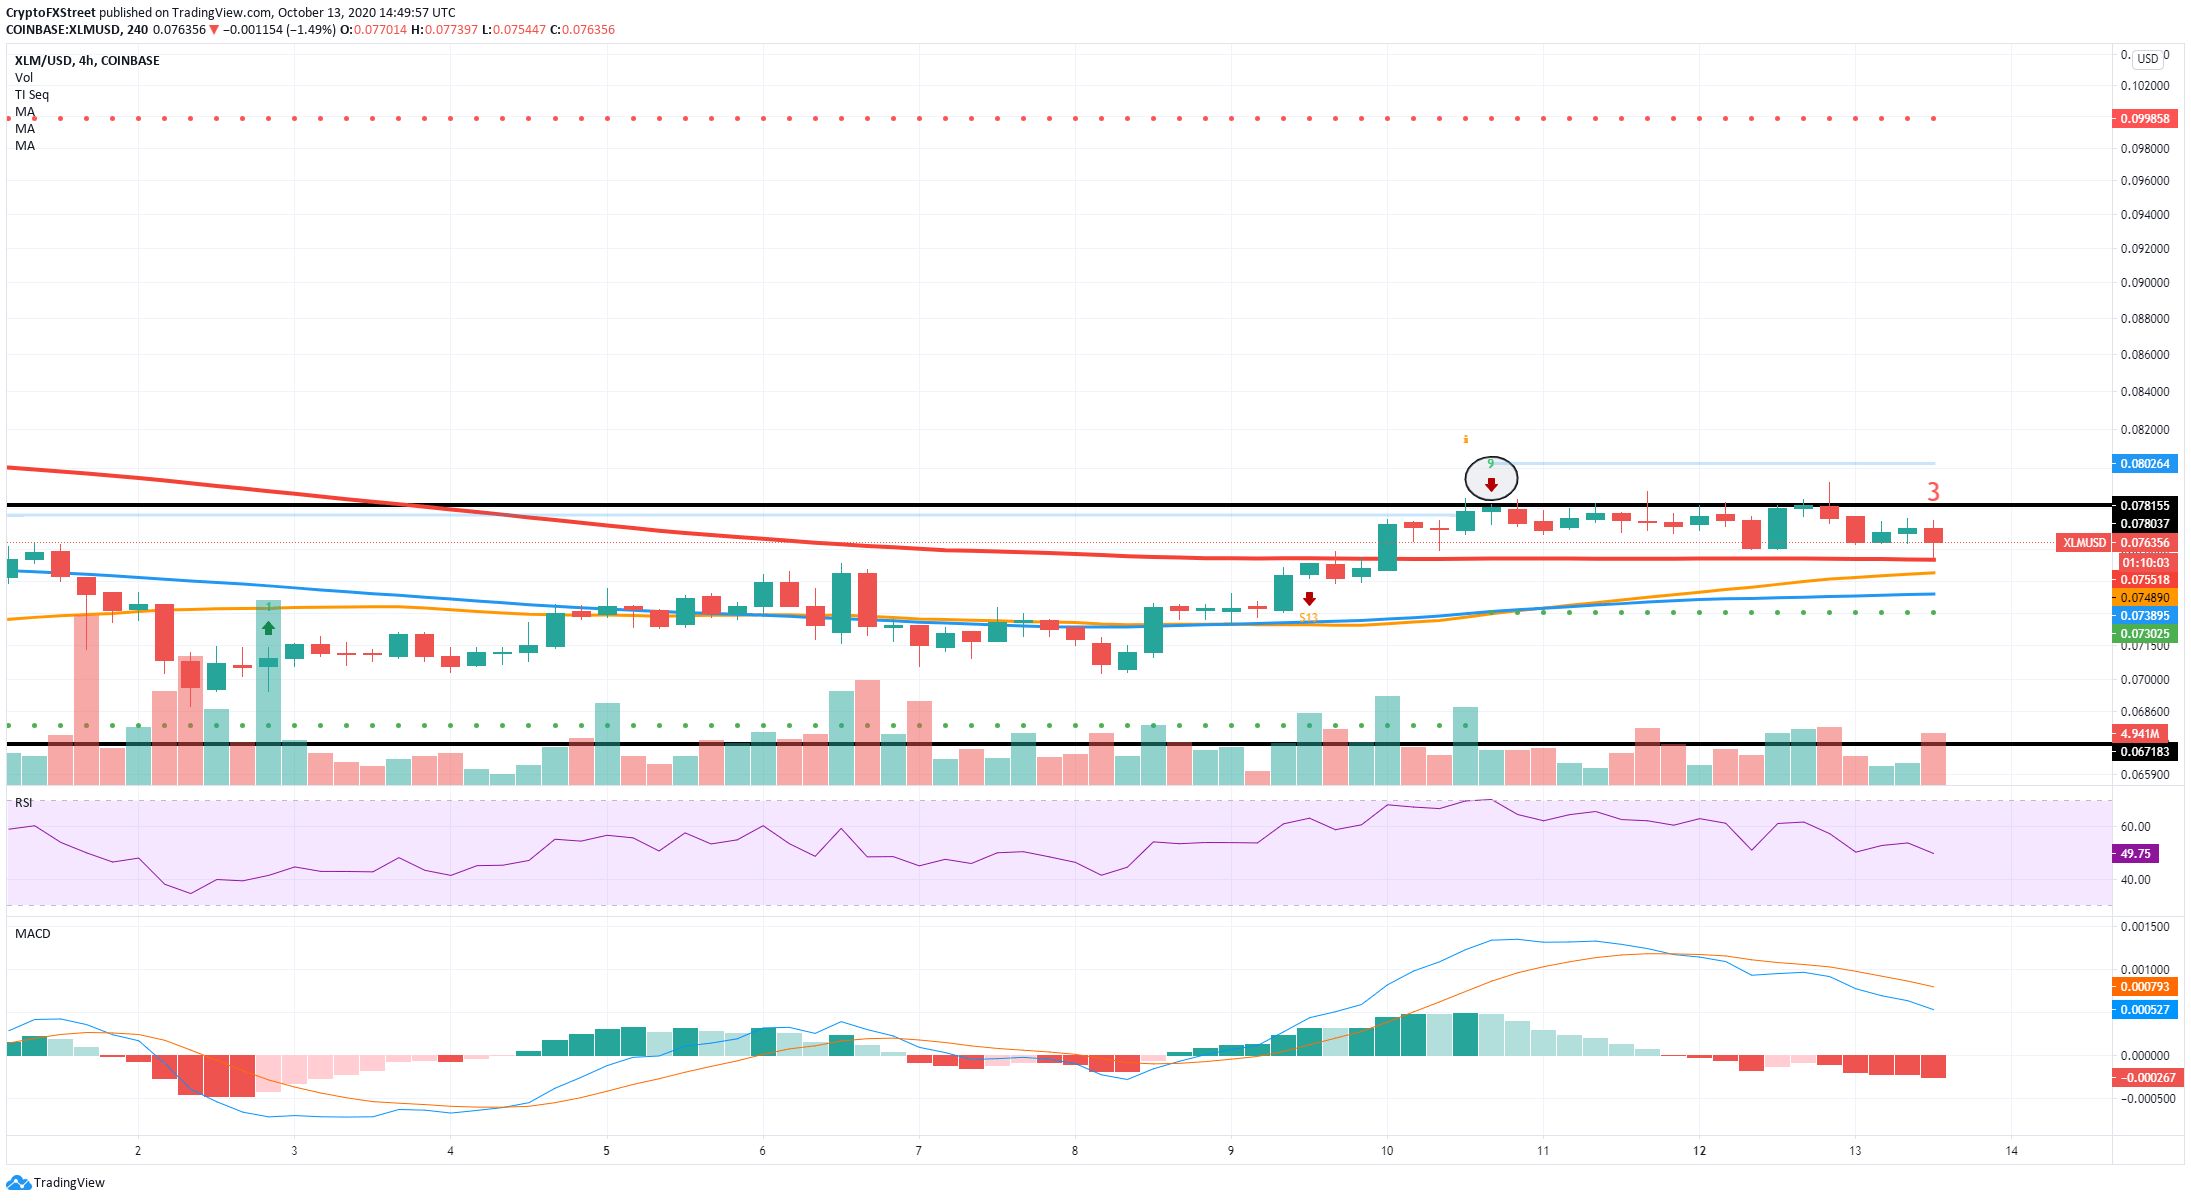
XLM/USD 4-hour chart
On the other hand, on the 4-hour chart, the last sell signal presented by the TD sequential indicator was invalidated by sideways trading. More importantly, bulls are currently defending all three SMAs. The nearest is the 200-SMA at $0.076, which has acted as a healthy support level for the past three days.
The most crucial resistance level was established at $0.078 and tested several times between October 10 and today. A breakout above this point can push the digital asset to $0.08, where the 50-SMA stands on the daily chart and up to $0.09, the 100-SMA.
Critical points to look out for
On the bearish side, if the selling pressure continues mounting and the price of XLM gets rejected from the 50-SMA on the daily chart, we could see bears attempt to break $0.07 and take XLM down to $0.067, the nearest support level with a maximum price target of $0.054.
If the bulls can defend the 200-SMA at $0.076 on the 4-hour chart, they will have a real chance of pushing XLM towards $0.08 in the short-term. The longer-term price target would be $0.09, where the 50-SMA is established on the daily chart.
Information on these pages contains forward-looking statements that involve risks and uncertainties. Markets and instruments profiled on this page are for informational purposes only and should not in any way come across as a recommendation to buy or sell in these assets. You should do your own thorough research before making any investment decisions. FXStreet does not in any way guarantee that this information is free from mistakes, errors, or material misstatements. It also does not guarantee that this information is of a timely nature. Investing in Open Markets involves a great deal of risk, including the loss of all or a portion of your investment, as well as emotional distress. All risks, losses and costs associated with investing, including total loss of principal, are your responsibility. The views and opinions expressed in this article are those of the authors and do not necessarily reflect the official policy or position of FXStreet nor its advertisers.