Ripple releases quarterly report showing a 300% in XRP sales, the price remains flat
|- Ripple has published the quarterly XRP Markets Report showing a massive 300% increase in sales.
- It seems that the price of XRP hasn’t reacted to the news just yet.
The newest quarterly report shows many statistics in favor of XRP during Q3 2020 compared to the last quarter. The reported daily volume has increased from an average of $196.28 million daily in Q2 to $403.58 million in Q3.
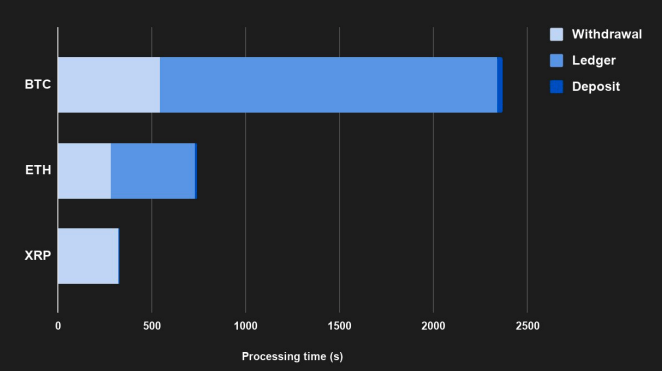
The report also states that XRP is used as a bridge currency instead of BTC or ETH. The chart above shows transfers of $10,000 or above equivalent in BTC, ETH, and XRP from Binance to Coinbase, indicating that XRP is mostly used to withdraw as it is faster.
XRP is extremely energy efficient by design, with transactions settling without the enormous energy costs associated with proof-of-work mining required by other blockchain based transactions. In fact, for every 1 million transactions, BTC uses power equivalent to 4.51 billion lightbulb hours compared to XRP, which uses power equivalent to 79,000 lightbulb hours. This means that the energy consumption of XRP is 57,000x more efficient than BTC.
Ripple has also partnered with various leading technology and conservation organizations like Energy Web Foundation, or the XRPL Foundation. It seems that a spike in buying pressure for XRP could easily boost its price thanks to strong fundamentals.
Can XRP finally get its breakout to $0.30?
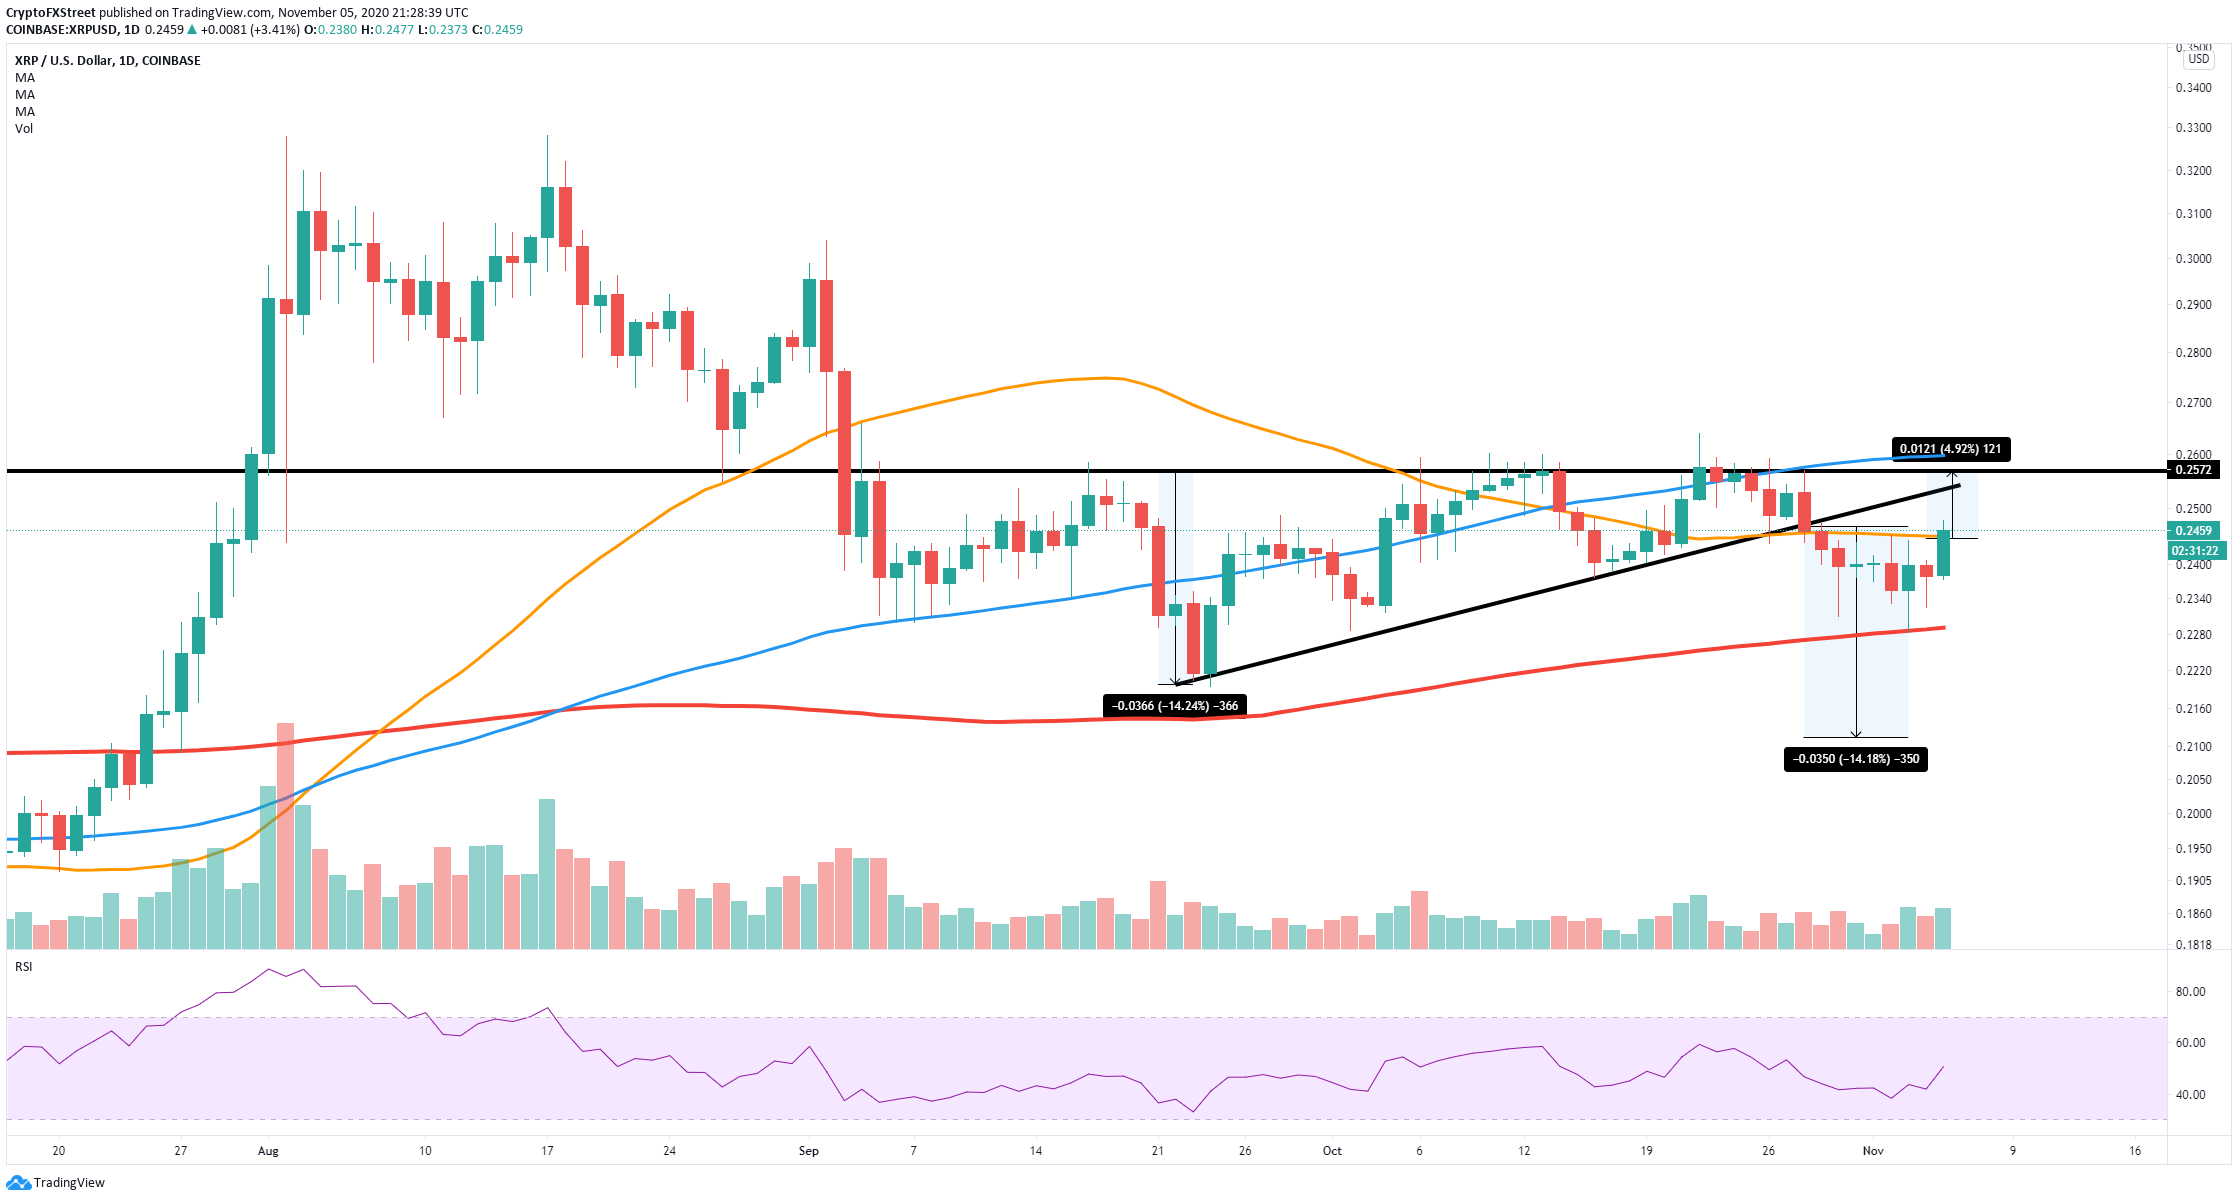
The price of XRP is $0.2457, currently fighting to stay above the 50-SMA resistance level at $0.244 on the daily chart. A breakout above this point can easily drive the XRP’s price towards $0.257, which is the upper boundary of an old ascending triangle pattern. Perhaps, the recent positive metrics reported by Ripple can help the digital asset get that small boost to convert the 50-SMA into a support level.
XRP/USD daily chart
On the other hand, another rejection from $0.244 can quickly make XRP’s price drop towards the 200-SMA at $0.2291 and eventually towards the bearish price target of $0.212 after the breakdown of the ascending triangle on October 28.
Information on these pages contains forward-looking statements that involve risks and uncertainties. Markets and instruments profiled on this page are for informational purposes only and should not in any way come across as a recommendation to buy or sell in these assets. You should do your own thorough research before making any investment decisions. FXStreet does not in any way guarantee that this information is free from mistakes, errors, or material misstatements. It also does not guarantee that this information is of a timely nature. Investing in Open Markets involves a great deal of risk, including the loss of all or a portion of your investment, as well as emotional distress. All risks, losses and costs associated with investing, including total loss of principal, are your responsibility. The views and opinions expressed in this article are those of the authors and do not necessarily reflect the official policy or position of FXStreet nor its advertisers.