LTC/USD technical analysis: Potential breakout scenario on the 4-hour chart
|
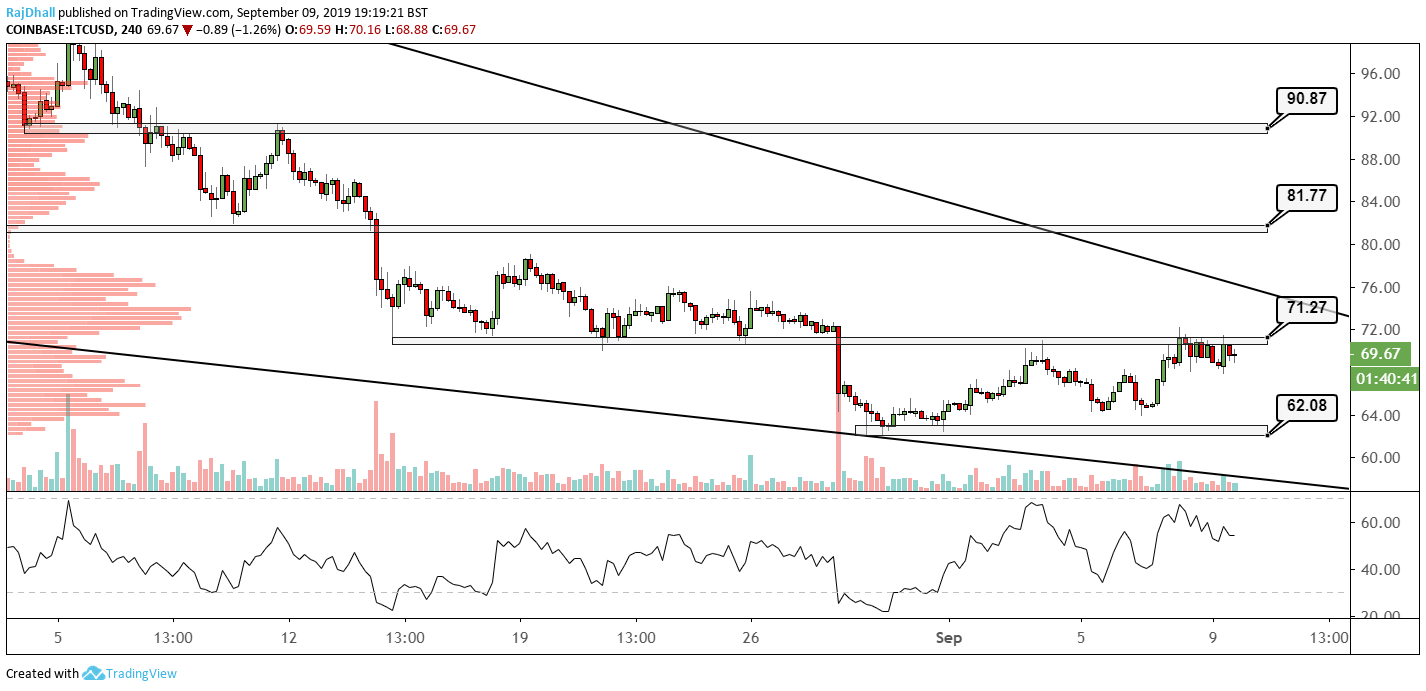
After the bear phase from 140 down to 60 the price has now made a lower high and a lower low on the 4-hour chart.
This is significant as the bear market was so fierce. The RSI indicator has also pushed higher but price consolidating and needs a firm break of 70.
The resistance level at 71.27 is holding firm for now and if we do see a sustained break watch to see if it on big volume.
On the downside 62 is the main support and a break under that support would mean the downtrend is back in tack.
74.12 is the main value area on the chart. This is the price where most contracts changed hand and is also known as the value area.
This chart is indicating the LTC/USD pair could move higher but as long as that resistance is broken.
Information on these pages contains forward-looking statements that involve risks and uncertainties. Markets and instruments profiled on this page are for informational purposes only and should not in any way come across as a recommendation to buy or sell in these assets. You should do your own thorough research before making any investment decisions. FXStreet does not in any way guarantee that this information is free from mistakes, errors, or material misstatements. It also does not guarantee that this information is of a timely nature. Investing in Open Markets involves a great deal of risk, including the loss of all or a portion of your investment, as well as emotional distress. All risks, losses and costs associated with investing, including total loss of principal, are your responsibility. The views and opinions expressed in this article are those of the authors and do not necessarily reflect the official policy or position of FXStreet nor its advertisers.