Ethereum technical analysis: Great technical breakout on decent volume
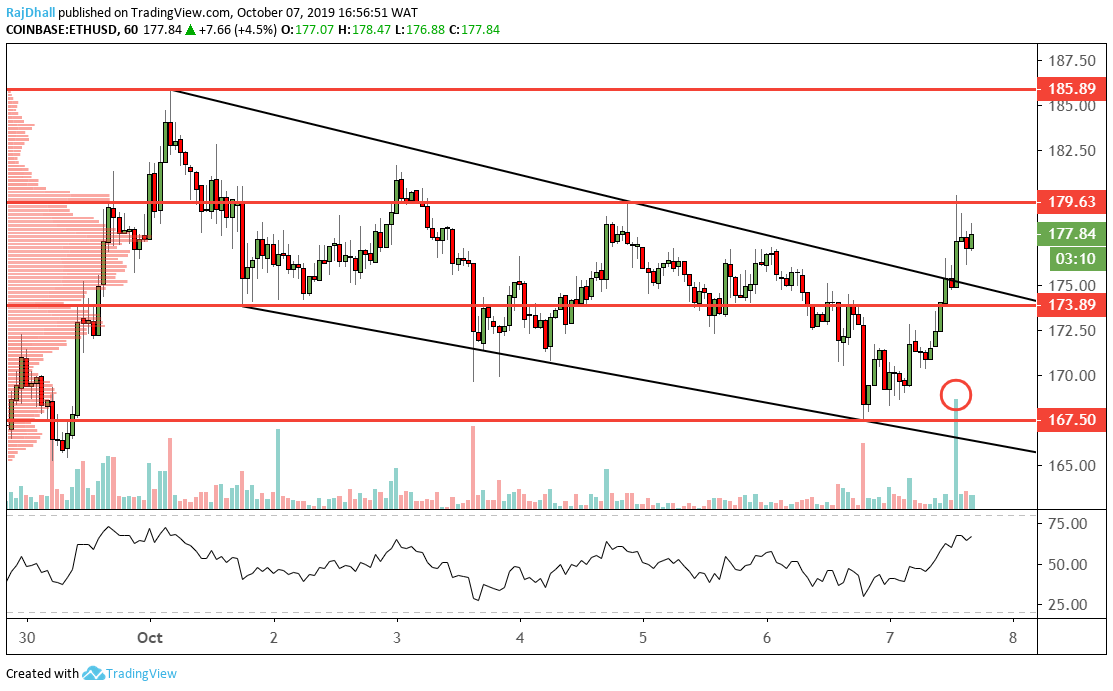
|- ETH/USD broke out the channel formation on the hourly chart.
- Ethereum is now trading 4.50% higher as general crypto sentiment turns positive.
Ethereum has broken out of the channel formation on the hourly chart. The move was backed by good volume on the Coinbase exchange.
Now the 180.00 level is the resistance to beat but it has proved to be a difficult level in the past.
Right now price is resting at the value area. This is indicated by the bell curve on the left-hand side of the chart.
The relative strength indicator (RSI) has pushed to the highest level since the beginning of last month.
If we do get a retracement the market might look at the trendline it has just broken out of.
Information on these pages contains forward-looking statements that involve risks and uncertainties. Markets and instruments profiled on this page are for informational purposes only and should not in any way come across as a recommendation to buy or sell in these assets. You should do your own thorough research before making any investment decisions. FXStreet does not in any way guarantee that this information is free from mistakes, errors, or material misstatements. It also does not guarantee that this information is of a timely nature. Investing in Open Markets involves a great deal of risk, including the loss of all or a portion of your investment, as well as emotional distress. All risks, losses and costs associated with investing, including total loss of principal, are your responsibility. The views and opinions expressed in this article are those of the authors and do not necessarily reflect the official policy or position of FXStreet nor its advertisers.