ETH/USD technical analysis: Ethereum breaks higher to near breakeven for the session
|- Ethereum moves higher as a bout of buying volume comes in.
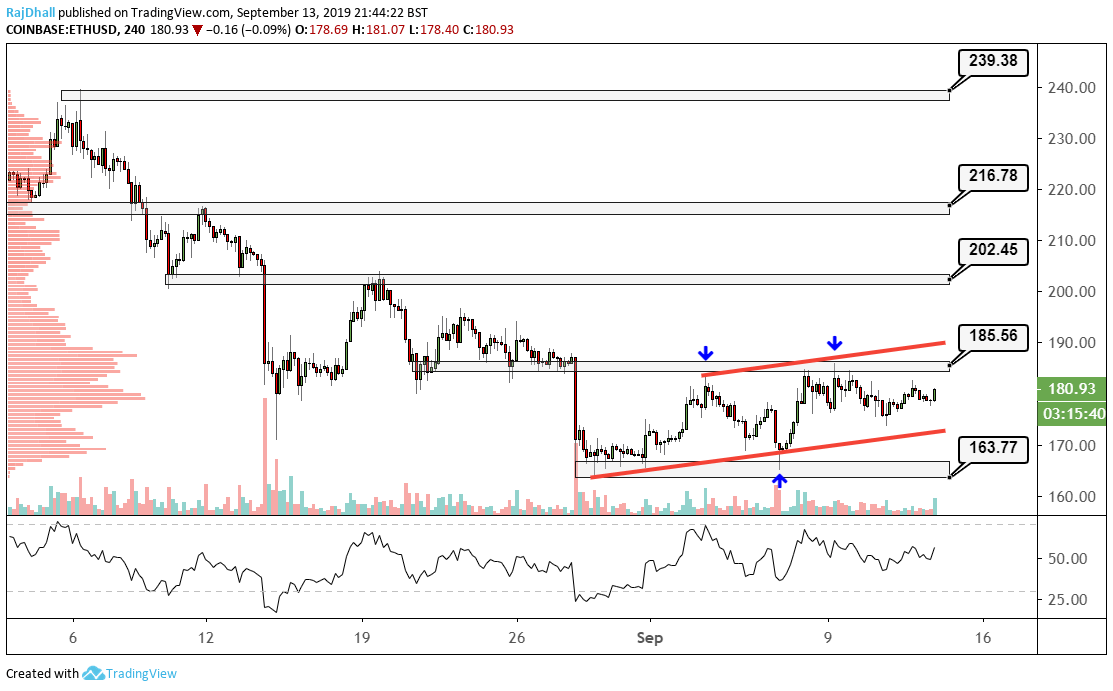
- The current chart pattern indicates the move will continue with the next resistance at 185.56.
After rejecting 163 last week, the price has now moved away from its base formation to make a few consecutive higher lows and higher highs.
Price is moving toward the next resistance at 185.56, the level used as a resistance a few times over the last month.
It has been quite the downtrend, and a move from 240 to near 160 is a big drop. After this sideways move let's see if ETH/USD can move higher.
The last four-hour candle was a hammer and indicated a move higher. We need to see how this candle closes but the momentum and volume right now look strong.
On the daily chart, the RSI (Relative Strength Index) is showing a hidden divergence so that is another major positive sign.
Information on these pages contains forward-looking statements that involve risks and uncertainties. Markets and instruments profiled on this page are for informational purposes only and should not in any way come across as a recommendation to buy or sell in these assets. You should do your own thorough research before making any investment decisions. FXStreet does not in any way guarantee that this information is free from mistakes, errors, or material misstatements. It also does not guarantee that this information is of a timely nature. Investing in Open Markets involves a great deal of risk, including the loss of all or a portion of your investment, as well as emotional distress. All risks, losses and costs associated with investing, including total loss of principal, are your responsibility. The views and opinions expressed in this article are those of the authors and do not necessarily reflect the official policy or position of FXStreet nor its advertisers.