ChainLink Price Prediction: LINK could slip to $8 according to several indicators
|- LINK has lost the $9.22 support level establishing a new lower low.
- It seems that the digital asset is in free-fall as bulls are struggling to find support on the way down.
ChainLink is down by more than 56% of its peak at $20 on August 16. Although the pullback is notable, LINK is still up 470% since March 13 after the overall market crash.
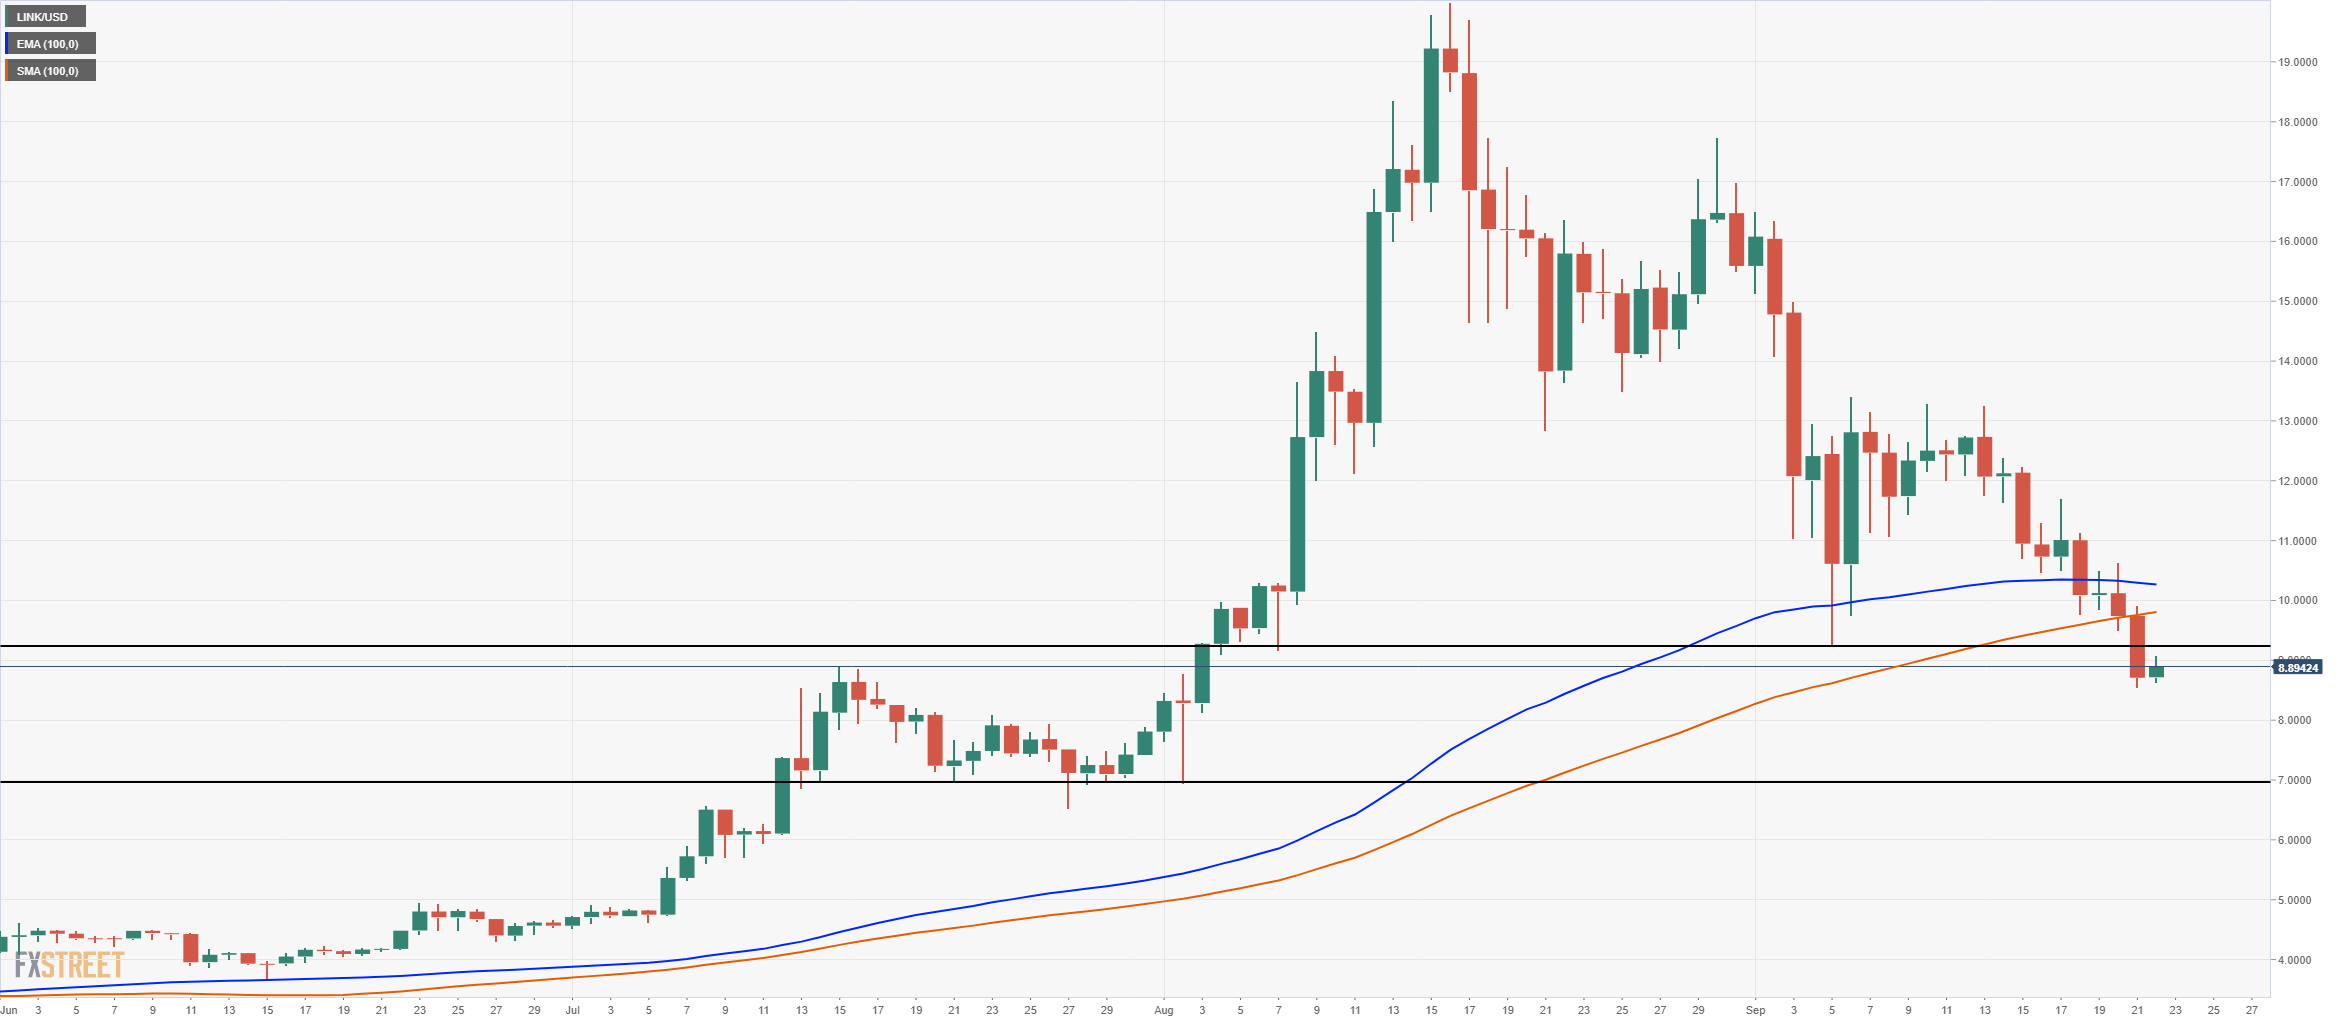
LINK/USD daily chart
Things aren't looking too bright for LINK on the daily chart after the price pierced through the 100-EMA and the 100-SMA. Furthermore, bears were able to push the price below $9.22, the low of the dump on September 5.
ChainLink Daily Active Addresses
 [15.15.46, 22 Sep, 2020]-637363783010826568.png)
Looking at the past price action, it seems that the number of daily active addresses usually goes up when a big price pump is about to happen. For instance, back on August 8, the number of addresses jumped to 22,622 from 7,947 and stayed high for the next week while LINK's price went from $10 to $18, only five days later.
It seems that the number of active addresses has continued decreasing since September 5, which would indicate that bulls are not yet back in town. The price of LINK could continue declining towards the nearest support level at $8.
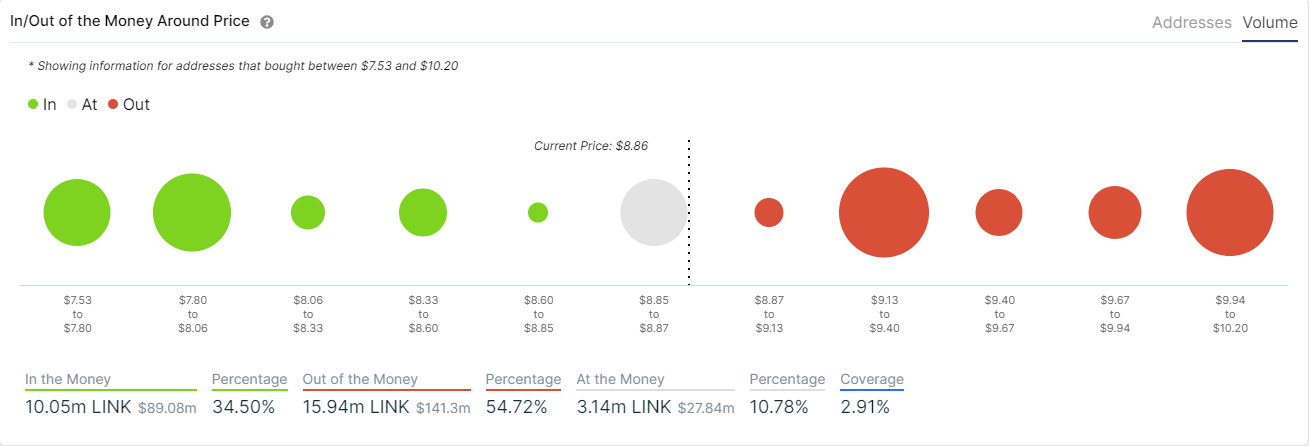
LINK IOMAP Chart
The In/Out of the Money Around Price indicator by IntoTheBlock seems to confirm this theory as it shows relatively low support levels between $9 and 8$ but a strong cluster of addresses that bought at $8.
LINK/USD 4-hour chart
-637363783558744613.png)
The bears might have created a bear flag with the pole starting on September 20. Furthermore, looking at the Holders Distribution chart, we can see that the number of whales holding between 100,000 coins and 1,000,000 coins has dropped from 255 on September 1to 252 currently. Similarly, holders with at least 1,000,000 coins also dropped from 51 to 49.
ChainLink Holders Distribution Chart
 [15.27.58, 22 Sep, 2020]-637363783787039389.png)
However, the MACD is signaling a bull cross within the next few hours, which could invalidate the bear flag if bulls can climb above $9 where there isn't a lot of resistance, according to the IOMAP chart above.
Investors need to be looking at the $9 resistance level to the upside and $8 as the lowest support level in the short-term.
Information on these pages contains forward-looking statements that involve risks and uncertainties. Markets and instruments profiled on this page are for informational purposes only and should not in any way come across as a recommendation to buy or sell in these assets. You should do your own thorough research before making any investment decisions. FXStreet does not in any way guarantee that this information is free from mistakes, errors, or material misstatements. It also does not guarantee that this information is of a timely nature. Investing in Open Markets involves a great deal of risk, including the loss of all or a portion of your investment, as well as emotional distress. All risks, losses and costs associated with investing, including total loss of principal, are your responsibility. The views and opinions expressed in this article are those of the authors and do not necessarily reflect the official policy or position of FXStreet nor its advertisers.