BTC/USD Technical Analysis: 8K might be the next support zone
|- The general crypto sentiment is still weak as BTC/USD heads to 8K.
- At the moment the internal trendline support is holding but the volume is still supporting the buy-side.
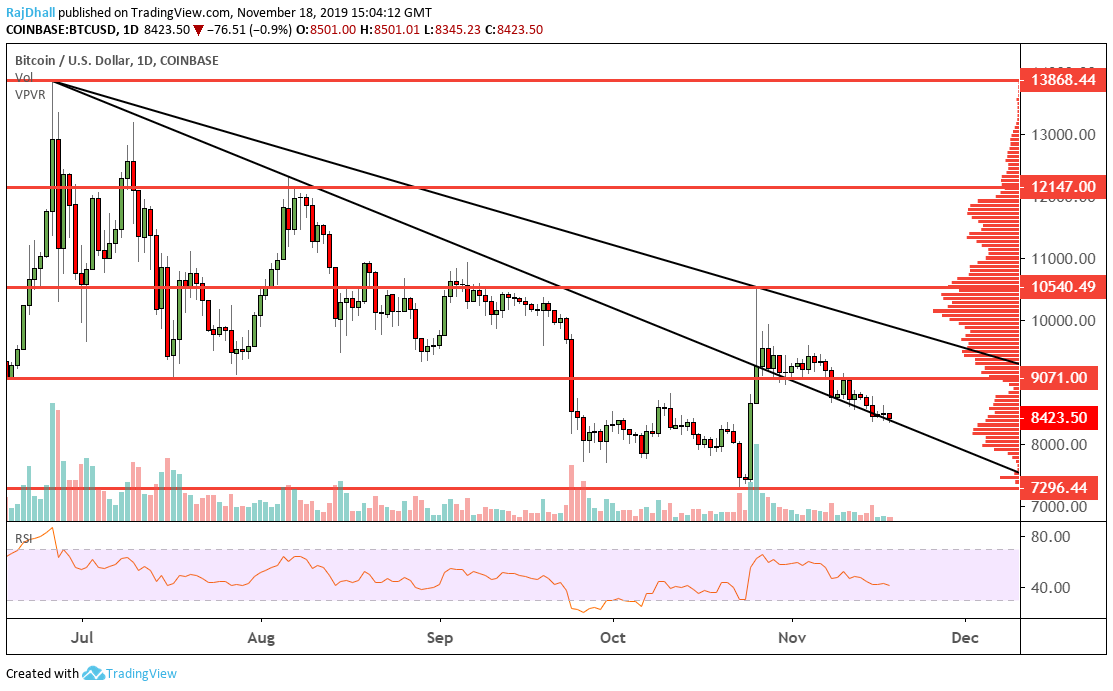
Bitcoin Daily Chart
BTC/USD has been making a consolidation pattern that has been grinding lower towards 8K.
Right now the price is at the peak of the current distribution area that could potentially provide some support.
The key support level is 7296.44 and if that level breaks it could indicate some more weakness to the downside.
The resistance zone above the price at the moment is holding at 9071.00. This level has been used as support three times on the chart below.
Having said that if the price does manage to break it will be a good bullish signal.
For now, this is a consolidation phase and volatility is low. There seems to be the need for a catalyst to inspire some volatility in price.
Additional Levels
Information on these pages contains forward-looking statements that involve risks and uncertainties. Markets and instruments profiled on this page are for informational purposes only and should not in any way come across as a recommendation to buy or sell in these assets. You should do your own thorough research before making any investment decisions. FXStreet does not in any way guarantee that this information is free from mistakes, errors, or material misstatements. It also does not guarantee that this information is of a timely nature. Investing in Open Markets involves a great deal of risk, including the loss of all or a portion of your investment, as well as emotional distress. All risks, losses and costs associated with investing, including total loss of principal, are your responsibility. The views and opinions expressed in this article are those of the authors and do not necessarily reflect the official policy or position of FXStreet nor its advertisers.