Bitcoin price analysis: summer surge surprise? No, it's a recurring pattern and it may be only the beginning
|- Price analysis of Bitcoin shows that the cryptocurrency tends to rise in summer months.
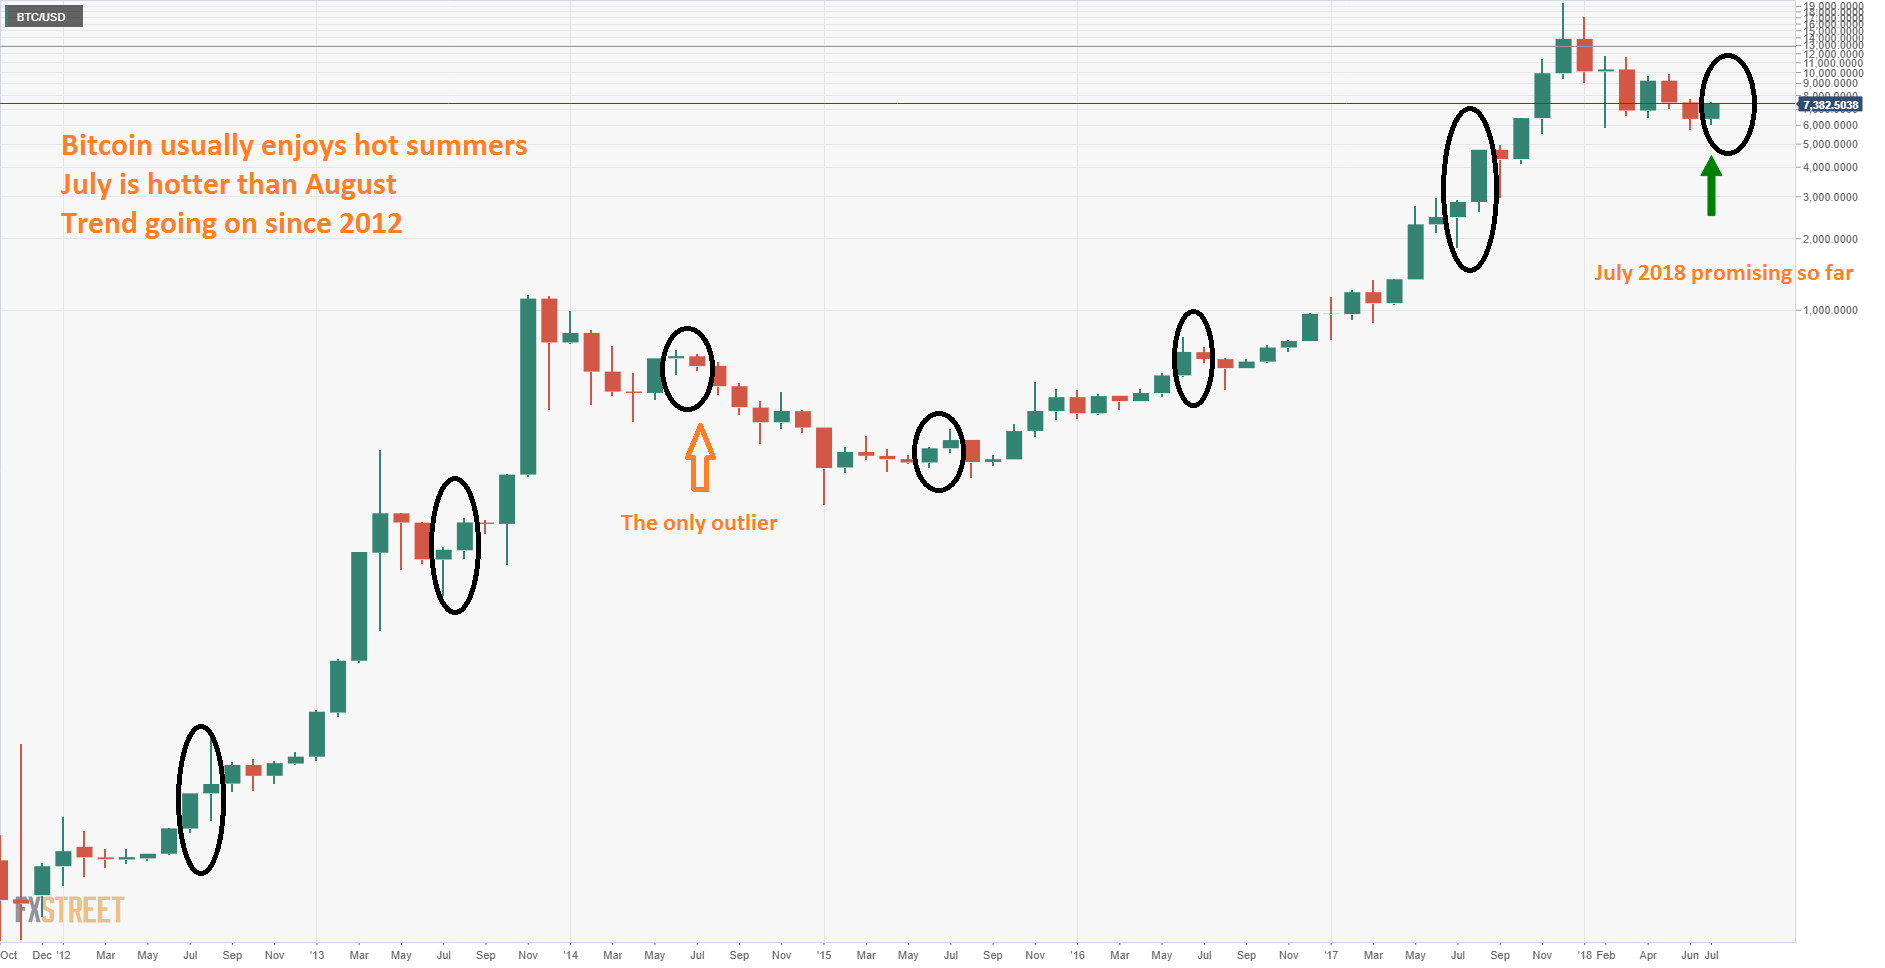
- Seven-year scope shows July is hotter than August.
- The recent surge looks modest, indicating more increases could come.
The BTC/USD surged above $7,000 on July 17th, sparking fresh enthusiasm after a few months of declines amid low volatility. There were some fundamental reasons such as Blackrock's interest in blockchain technology, Mastercard's crypto patent filing, and the moves by IBM. Other analysts pointed out a short squeeze: some traders have been caught in short positions for too long, and as prices stabilized, they were forced to exit, sparking a rally.
Surprisingly positive breaking news and a surprising break of short positions can explain the rally in the near-term. Yet the broader scope shows that nobody should have been surprised. Bitcoin is the grandaddy of cryptocurrencies, and its relatively long history of price action provides more profound insights.
BTC/USD price pattern
Seasonality may be playing a role. Looking back at the BTC/USD price action since 2012, we see that the summer months of July and August are usually hot: cryptocurrencies are on the rise. The only outlier is 2014, when prices advanced in July but slipped in August, resulting in a "cold summer" for the digital coin.
In most years, the cryptocurrency rose at a quicker pace in July than in August. In many countries, August is a slower month as people go on vacation. Nevertheless, 2017 was different, with the explosion coming in August.
The graph below uses a logarithmic scale, thus reflecting the changes in prices as they happened, Bitcoin made a convincing break above $1,000 only in 2017. Using a regular price scale does not allow seeing the magnitude of the moves before that year. The logarithmic Bitcoin chart reflects the action in a better manner.
Further fire for Bitcoin?
As the chart shows, the rise in July is relatively modest. At the time of writing, the BTC/USD has emerged from the abyss and pared the losses suffered in June. In previous years, Bitcoin surpassed June's closing levels in June. And contrary to other things we learned, this pattern has no outlier.
So, if the seasonal pattern continues, the recent settling above $7,000 may only be the beginning. Further gains may be seen throughout July. The increases may extend into August if we look at 2017, but looking at the broader scope, the second summer month could be more choppy.
More:
Information on these pages contains forward-looking statements that involve risks and uncertainties. Markets and instruments profiled on this page are for informational purposes only and should not in any way come across as a recommendation to buy or sell in these assets. You should do your own thorough research before making any investment decisions. FXStreet does not in any way guarantee that this information is free from mistakes, errors, or material misstatements. It also does not guarantee that this information is of a timely nature. Investing in Open Markets involves a great deal of risk, including the loss of all or a portion of your investment, as well as emotional distress. All risks, losses and costs associated with investing, including total loss of principal, are your responsibility. The views and opinions expressed in this article are those of the authors and do not necessarily reflect the official policy or position of FXStreet nor its advertisers.