Binance Coin Price Prediction: BNB ready to smash through the yearly high at $33
|- Numerous on-chain metrics have turned in favor of BNB bulls indicating that the digital asset has more room to go up.
- BNB also managed to see a bullish breakout from a notable daily pattern.
BNB is currently trading at $30.54 after a bullish breakout, gaining $400 million in market capitalization. The digital asset is on the verge of surpassing BCH at $4.4 billion in total, ranked 5th as only $20 million separate both cryptocurrencies. Binance, the exchange behind the coin, saw record-high numbers when it comes to derivatives volume, surpassing Huobi and OKEx, and becoming the leader.
BNB seems primed to re-test the high at $33
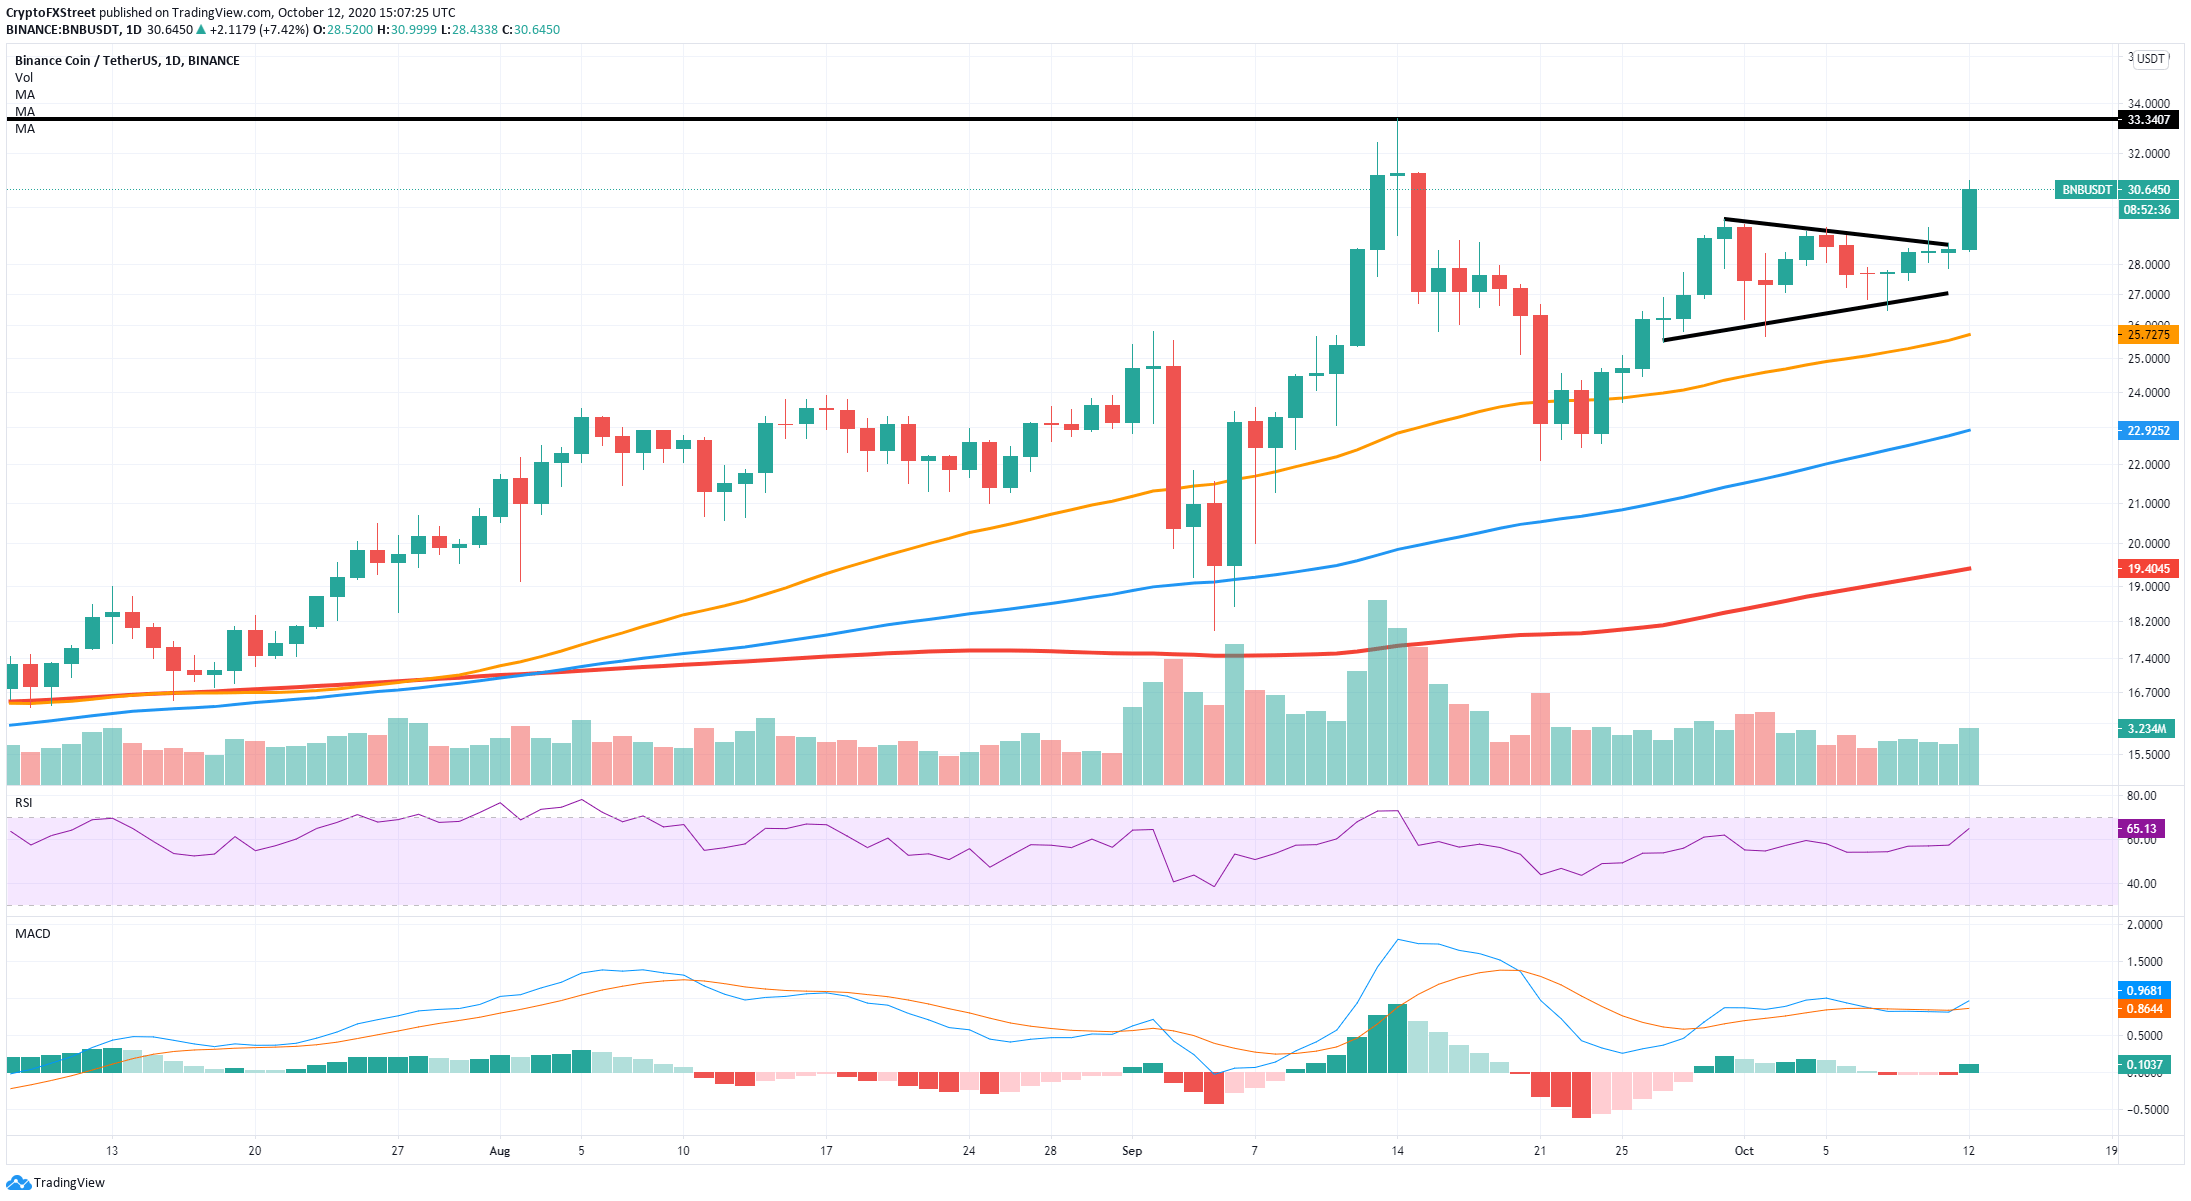
The daily chart presented a symmetrical triangle pattern with a small fakeout on October 10, but eventually, BNB managed to climb above the upper trendline. The digital asset is up by 9% in the past 24 hours after the breakout, and it’s only facing resistance at $33.38, the 2020-high.
BNB/USDT Daily Chart
On the daily chart, BNB has managed to keep the 50-SMA as a healthy support level and quickly turn the MACD bullish again after a short bearish cross on October 8. The bullish breakout of the symmetrical triangle shows a lot of strength for the bulls, which are eying up $33.38.
BNB Holders Distribution Chart
 [17.00.30, 12 Oct, 2020]-637381125662138684.png)
It seems that more BNB whales are joining in. The Holders Distribution chart by Santiment shows that the number of holders with 10,000 - 100,000 coins increased from 39 to 42 since October. Similarly, the number of whales with at least 100,000 coins and no more than 1,000,000 increased by one in the same period.
BNB Daily Active Addresses
 [17.04.16, 12 Oct, 2020]-637381125910285089.png)
Furthermore, the number of daily active addresses has been growing significantly since October 1, from a low of 2,996 to a peak of 6,961. This on-chain metric represents the interest in BNB and the daily level of crowd interaction with the token, a positive result.
Binance Coin could be poised for a short-term pullback
Despite the current bullish momentum of BNB, some indicators are not so positive. On the 12-hour chart, the TD sequential indicator has just presented a sell signal, not yet validated. The next support level is found at $27, where the 50-SMA is currently standing. Validation of the signal could drop BNB towards $27 in the short-term.
BNB/USDT 12-hour chart
Furthermore, the RSI is on the verge of overextension, something that historically has represented a pullback. On September 14, the RSI got overbought, and the price of BNB dropped by 34% over the following week. Similarly, on September 29, the RSI was close to overextension, and BNB lost 13% of its value in the next two days. A similar drop would take Binance Coin down to the level mentioned above at $27.
Crucial resistance and support points
BNB is bullish and trading inside a daily uptrend. The price has climbed above a symmetrical triangle pattern and cracked $30. The next target price for bulls is $33.38, the 2020-high. After that point, the next critical point is $39.5, the all-time high.
On the other hand, BNB could be facing a correction in the short-term before resuming its bullish trend. The most important support level would be $30, a breakout below this point would validate the sell signal on the 12-hour chart and most likely take the price down to $27.
Information on these pages contains forward-looking statements that involve risks and uncertainties. Markets and instruments profiled on this page are for informational purposes only and should not in any way come across as a recommendation to buy or sell in these assets. You should do your own thorough research before making any investment decisions. FXStreet does not in any way guarantee that this information is free from mistakes, errors, or material misstatements. It also does not guarantee that this information is of a timely nature. Investing in Open Markets involves a great deal of risk, including the loss of all or a portion of your investment, as well as emotional distress. All risks, losses and costs associated with investing, including total loss of principal, are your responsibility. The views and opinions expressed in this article are those of the authors and do not necessarily reflect the official policy or position of FXStreet nor its advertisers.