USD/CAD breaks below dense support level, may have lots more room to fall — Confluence Detector
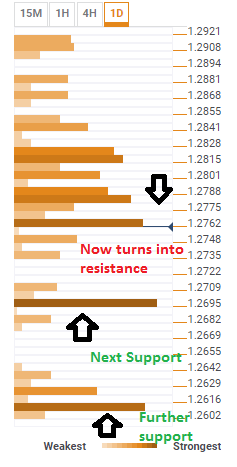
|The Technical Confluences Indicator shows that the plunge that the USD/CAD took breaks a key confluence cluster of support at 1.2762. This is the meeting point of the Fibonacci 61.8% one day, the Bolinger Band 15 minute Lower (Stdv 2.2), Pivot Point one month S1, and the 15 and one-hour highs. This level now turns into support.
After breaking below this line, the pair continues lower. The next significant cluster of support is only at 1.2695, where the Fibo 161.8% one day, the SMA100- one day and the Pivot Point one-week S1 meet. All are critical technical indicators.
Further down, serious support is only around 1.2610, where the Fibo 161.8% one month and the Pivot Point one-week S2 meet.
The upbeat Quarterly BOC Business Outlook is behind the move. The Canadian central bank is somewhat optimistic and this boosts the Canadian Dollar. The optimism is also visible on the technical charts:
Confluence Detector
The Confluence Detector finds exciting opportunities using Technical Confluences. The TC is a tool to locate and point out those price levels where there is a congestion of indicators, moving averages, Fibonacci levels, Pivot Points, etc. Knowing where these congestion points are located is very useful for the trader, and can be used as a basis for different strategies.
This tool assigns a certain amount of “weight” to each indicator, and this “weight” can influence adjacents price levels. This means that one price level without any indicator or moving average but under the influence of two “strongly weighted” levels accumulate more resistance than their neighbors. In these cases, the tool signals resistance in apparently empty areas.
Information on these pages contains forward-looking statements that involve risks and uncertainties. Markets and instruments profiled on this page are for informational purposes only and should not in any way come across as a recommendation to buy or sell in these assets. You should do your own thorough research before making any investment decisions. FXStreet does not in any way guarantee that this information is free from mistakes, errors, or material misstatements. It also does not guarantee that this information is of a timely nature. Investing in Open Markets involves a great deal of risk, including the loss of all or a portion of your investment, as well as emotional distress. All risks, losses and costs associated with investing, including total loss of principal, are your responsibility. The views and opinions expressed in this article are those of the authors and do not necessarily reflect the official policy or position of FXStreet nor its advertisers.