Gold Weekly Forecast: XAU/USD melts into next week with lower levels in sight
Premium|Take advantage of 50% OFF on your first month.
Start your subscription and get access to all our original articles.
You have reached your limit of 5 free articles for this month.
Get Premium without limits for only $9.99 for the first month
Access all our articles, insights, and analysts.
UNLOCK OFFER- Gold is trading 0.29% lower on Friday and 4.53% lower for the week.
- The price dipped below a key support level this week.
Gold 4-hour chart
The precious metals complex has been hampered by the persistent greenback strength. Since the price broke the triangle pattern on the chart the price hasn't looked back even once. There was a small glimmer of hope when the price retraced back to the green resistance line but the bears maintained their grip on the yellow metal.
At the moment the price is stuck at the red support zone which originated at the main consolidation low at USD 1863.24 per ounce. Since the price has printed below the level its fair to assume the pattern of lower lows and lower highs is set to continue.
The next target on the downside could be the little area of consolidation from mid-July between USD 1794 and 1847.34 per ounce. The indicators are still looking bearish with the Relative Strength Index still hugging the oversold area and the MACD signal lines under zero. The MACD histogram also looks like it is about to cross over to the downside.
Into next week the bearishness could continue but the move could get overextended and a pullback could be in order. Over the longer-term time horizon, the market is still in a strong bull trend but the red horizontal level could be the resistance to watch out for.
-637366473798832968.png)
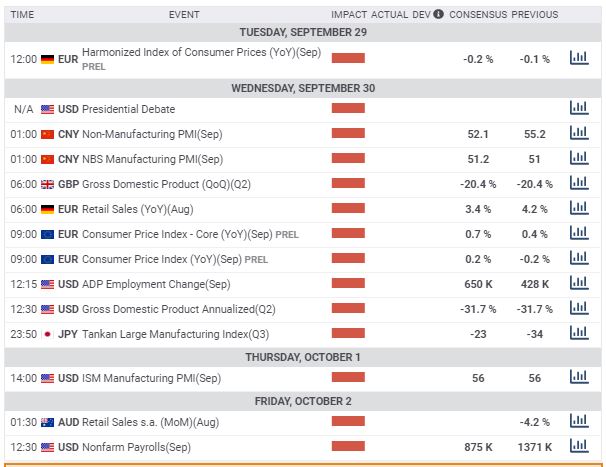
Fundamental backdrop & next weeks calendar
The dollar strength has been coming after the Fed looked toward the government for more stimulus rather than adding more fuel to the fire themselves. All throughout the week, this has been the rhetoric from the vast number of US central bank speakers. Bank of St. Louis President James Bullard bucked the trend, however, stating the U.S. economy has enough momentum to continue its recovery from the coronavirus slump even if Congress fails to pass the deal. This directly opposes the view of the Fed Chair Jerome Powell.
Non-farm payrolls will be the main highlight next week and the market will be pretty quiet leading into the event. In the middle of the week, there is also the ISM manufacturing reading and the number will update us on the state of the economy and the reading is for September so it will be an up to date representation. There could also some potential fireworks on Wednesday as the US presidential debate will be taking place in Cleveland, Ohio.
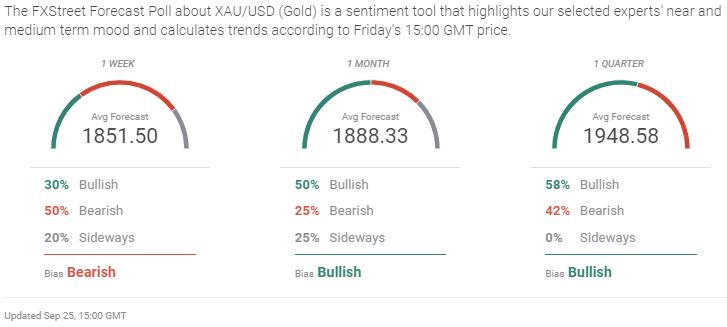
Forecast poll results
The poll results have dramatically changed this week but over the quarter traders are still bullish. The price of gold is around USD 1861 per troy ounce and this means over the month and quarter traders feel the prices will rise but over 1 weak the outlooks is still bearish.
Links to other articles
Why did precious metals get clobbered this week?
Gold: Stronger USD is a short-term blip – ANZ
- Gold is trading 0.29% lower on Friday and 4.53% lower for the week.
- The price dipped below a key support level this week.
Gold 4-hour chart
The precious metals complex has been hampered by the persistent greenback strength. Since the price broke the triangle pattern on the chart the price hasn't looked back even once. There was a small glimmer of hope when the price retraced back to the green resistance line but the bears maintained their grip on the yellow metal.
At the moment the price is stuck at the red support zone which originated at the main consolidation low at USD 1863.24 per ounce. Since the price has printed below the level its fair to assume the pattern of lower lows and lower highs is set to continue.
The next target on the downside could be the little area of consolidation from mid-July between USD 1794 and 1847.34 per ounce. The indicators are still looking bearish with the Relative Strength Index still hugging the oversold area and the MACD signal lines under zero. The MACD histogram also looks like it is about to cross over to the downside.
Into next week the bearishness could continue but the move could get overextended and a pullback could be in order. Over the longer-term time horizon, the market is still in a strong bull trend but the red horizontal level could be the resistance to watch out for.
Fundamental backdrop & next weeks calendar
The dollar strength has been coming after the Fed looked toward the government for more stimulus rather than adding more fuel to the fire themselves. All throughout the week, this has been the rhetoric from the vast number of US central bank speakers. Bank of St. Louis President James Bullard bucked the trend, however, stating the U.S. economy has enough momentum to continue its recovery from the coronavirus slump even if Congress fails to pass the deal. This directly opposes the view of the Fed Chair Jerome Powell.
Non-farm payrolls will be the main highlight next week and the market will be pretty quiet leading into the event. In the middle of the week, there is also the ISM manufacturing reading and the number will update us on the state of the economy and the reading is for September so it will be an up to date representation. There could also some potential fireworks on Wednesday as the US presidential debate will be taking place in Cleveland, Ohio.
Forecast poll results
The poll results have dramatically changed this week but over the quarter traders are still bullish. The price of gold is around USD 1861 per troy ounce and this means over the month and quarter traders feel the prices will rise but over 1 weak the outlooks is still bearish.
Links to other articles
Why did precious metals get clobbered this week?
Gold: Stronger USD is a short-term blip – ANZ
Information on these pages contains forward-looking statements that involve risks and uncertainties. Markets and instruments profiled on this page are for informational purposes only and should not in any way come across as a recommendation to buy or sell in these assets. You should do your own thorough research before making any investment decisions. FXStreet does not in any way guarantee that this information is free from mistakes, errors, or material misstatements. It also does not guarantee that this information is of a timely nature. Investing in Open Markets involves a great deal of risk, including the loss of all or a portion of your investment, as well as emotional distress. All risks, losses and costs associated with investing, including total loss of principal, are your responsibility. The views and opinions expressed in this article are those of the authors and do not necessarily reflect the official policy or position of FXStreet nor its advertisers.