GBP/USD: Looks ready for a 338 pips rally
|Since March 1, the GBP/USD has been trading sideways. At one point, it looked like the price was heading towards 1.33. Yet, the price has stabilised, and from a technical point of view, the price might be in the process of carving out an inverse head and shoulders pattern, with a target of 1.4353. The fundamental outlook is also favourable.
BoE QE to End and Fed on Hold
The British economy was one of the hardest hit by the pandemic, given its services orientation. Its weakness could now be its strength as the UK economy is set to reopen faster than most other countries, given that at least 50% of the total UK population has received at least one vaccine shot. The US is lagging at 42%. The Bank of England’s quantitative easing program is also due to end by the end of the year. I don’t think the BoE will turn hawkish anytime soon, but just letting QE expire could be bullish enough.
Also, as expected the Federal Reserve is reluctant to even consider to tapering their QE program, despite strong growth and high inflation, the latter is said to be short-term in nature. Investors will therefore be careful to bet on a stronger dollar in the very short-term, and this might help GBP/USD to trade above the neckline of the bullish head and shoulders pattern.
Technical outlook
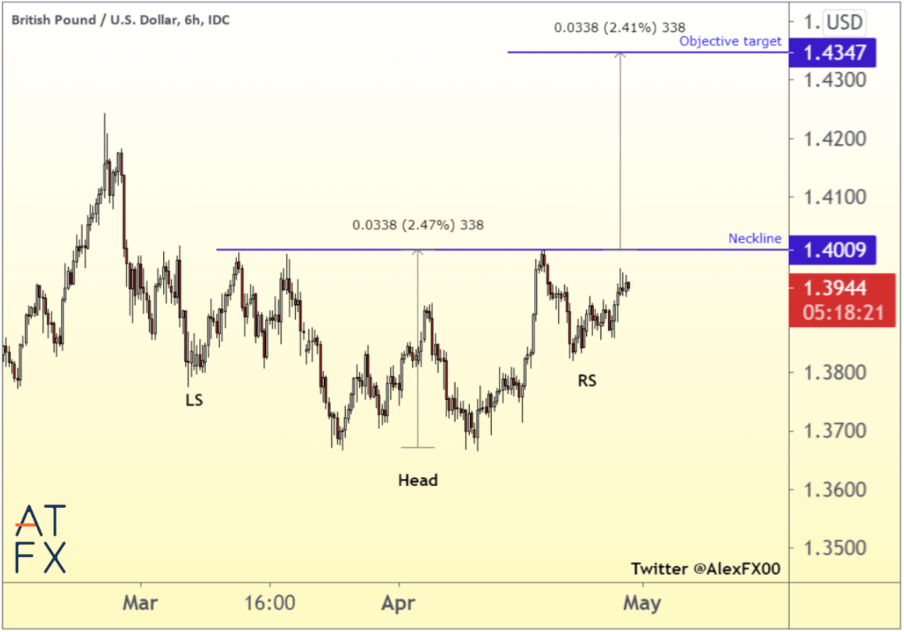
The March 5 low of 1.3778 might be the left shoulder, whilst the March 25 and April 9 low at 1.3670 might be considered to be the “head” of an inverse head and shoulders pattern. The right shoulder is still in the process of being chiselled out. The neckline at 1.4006 is, however, already in place. GBP/USD was rejected at 1.4006 on five days, and April 20 was the last time the price turned lower from this crucial level.
If the GBP to USD rate indeed manages to clinch above 1.4006, we might see the price reach 1.4353 weeks later. The 1.4353 target is derived by taking the difference of the neckline level at 1.4006 and the head low at 1.3670 and adding the difference to the breakout point.
GBP/USD Six-hour Chart
Information on these pages contains forward-looking statements that involve risks and uncertainties. Markets and instruments profiled on this page are for informational purposes only and should not in any way come across as a recommendation to buy or sell in these assets. You should do your own thorough research before making any investment decisions. FXStreet does not in any way guarantee that this information is free from mistakes, errors, or material misstatements. It also does not guarantee that this information is of a timely nature. Investing in Open Markets involves a great deal of risk, including the loss of all or a portion of your investment, as well as emotional distress. All risks, losses and costs associated with investing, including total loss of principal, are your responsibility. The views and opinions expressed in this article are those of the authors and do not necessarily reflect the official policy or position of FXStreet nor its advertisers.