EUR/USD has little resistance until $1.2480 after breaking higher — Confluence Detector
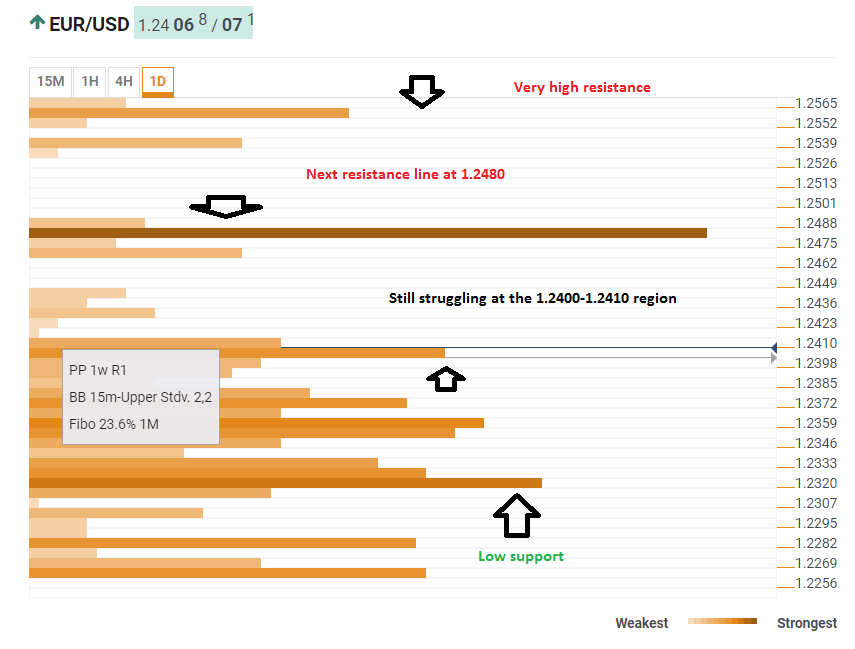
|After the EUR/USD made a move above $1.2400, the Technical Confluences Indicator shows the next areas of resistance on the way up. There are very few areas of congested caps between the current trading levels and $1.2480. Up there, we have a convergence of the one-month high, the Pivot Point one-day R3, PP one-month R1, and the PP one-week R2. All are strong lines.
Beyond this line, $1.2555 is the apparent barrier as the 52-week high and the highest level in over three years.
However, the pair is still struggling to confirm the move above $1.2400 and for good reasons. The $1.2400-1.2410 area the pair is struggling with is packed with significant technical lines: the SMA-5-15m, the Pivot Point one-day R1, the Bolinger Band 15m-Upper (Stdv. 2.2), the Pivot Point one-week R1, the Fibonacci 23.6% one-month, and more.
A failure to hold onto these gains may send the pair down to the $1.2360 region were we see the confluence of the SMA50-1h, the SMA100-1h, the Fibo 38.2% one-month, the SMA10-4h, the BB 1h-Middle, the Fibo 61.8% one-day, and the SMA-5 one-day.
Here is how it looks on the tool:
Confluence Detector
The Confluence Detector finds exciting opportunities using Technical Confluences. The TC is a tool to locate and point out those price levels where there is a congestion of indicators, moving averages, Fibonacci levels, Pivot Points, etc. Knowing where these congestion points are located is very useful for the trader, and can be used as a basis for different strategies.
This tool assigns a certain amount of “weight” to each indicator, and this “weight” can influence adjacents price levels. This means that one price level without any indicator or moving average but under the influence of two “strongly weighted” levels accumulate more resistance than their neighbors. In these cases, the tool signals resistance in apparently empty areas.
Information on these pages contains forward-looking statements that involve risks and uncertainties. Markets and instruments profiled on this page are for informational purposes only and should not in any way come across as a recommendation to buy or sell in these assets. You should do your own thorough research before making any investment decisions. FXStreet does not in any way guarantee that this information is free from mistakes, errors, or material misstatements. It also does not guarantee that this information is of a timely nature. Investing in Open Markets involves a great deal of risk, including the loss of all or a portion of your investment, as well as emotional distress. All risks, losses and costs associated with investing, including total loss of principal, are your responsibility. The views and opinions expressed in this article are those of the authors and do not necessarily reflect the official policy or position of FXStreet nor its advertisers.