Coffee bouncing from the Elliott wave blue box area
|In this technical blog, we will look at the past performance of 4 hour Elliott Wave Charts of Coffee futures ticker symbol: $KC_F, which we presented to members at the elliottwave-forecast. In which, the rally from 04 November 2020 low unfolded as an impulse structure. And showed a higher high sequence favored more upside extension to take place. Therefore, we advised members not to sell the Coffee & buy the dips in 3, 7, or 11 swings at the blue box areas. We will explain the structure & forecast below:
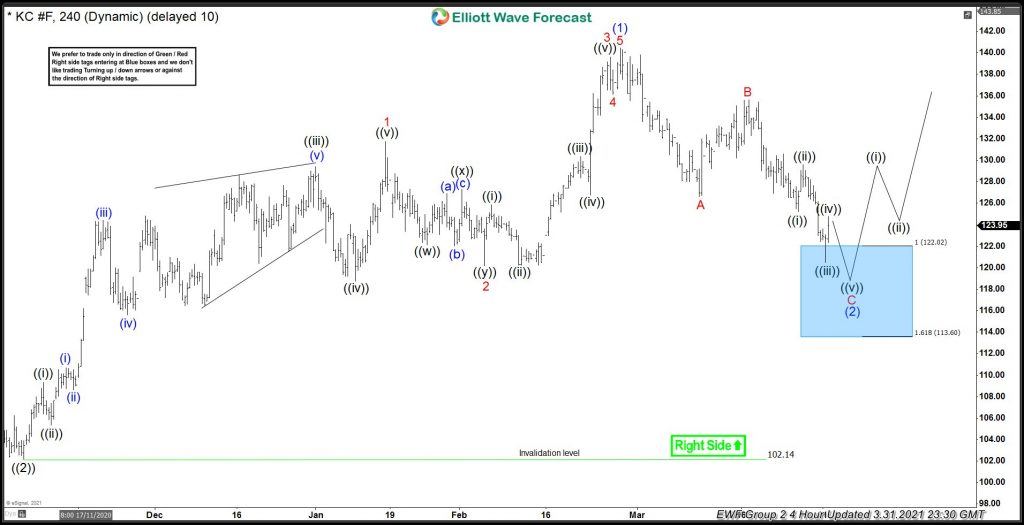
Coffee 4 Hour Elliott Wave Chart
Above is the 4hr Elliott wave Chart of Coffee from the 3/31/2021 update. In which, the instrument is showing 5 waves rally from $102.14 low in an impulse sequence where wave 1 ended at $131.75 high. Wave 2 ended at $120.20 low, wave 3 ended at $139.60, wave 4 ended at $136.15 and wave 5 ended at $140.45 high thus completed wave (1). Down from there, the Coffee made a pullback to correct the cycle from 11/04/2020 low.
The internals of that pullback unfolded as Elliott wave zigzag structure where wave A ended at $126.60. Wave B bounce ended at $135.65 high and wave C managed to reach the blue box area at $122.02- $113.60. From where buyers were expected to appear looking for more upside or for a 3 wave bounce at least. (It’s important to note that with further data we were able to adjust the degree of a pullback into a double three structure instead of a zigzag).
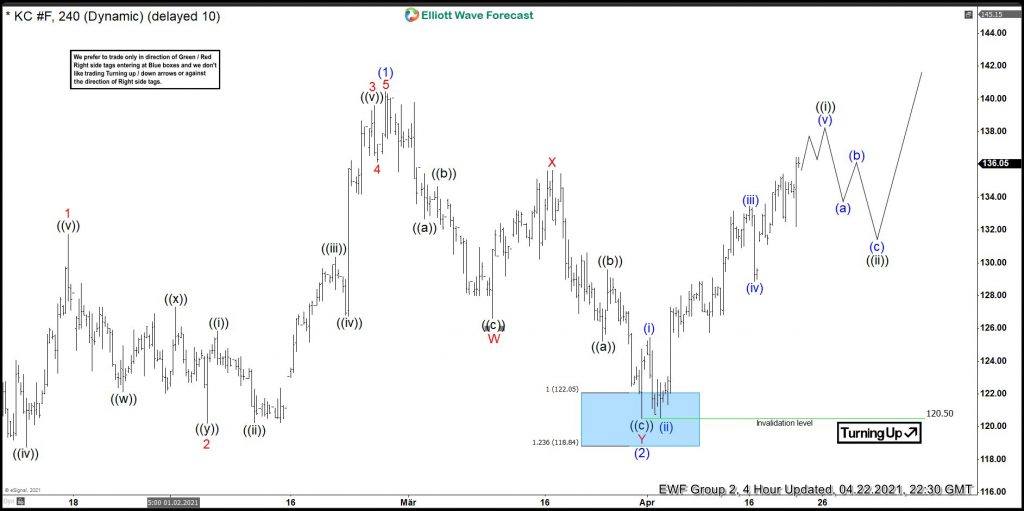
Coffee Latest 4 Hour Chart
Here’s the latest 4hr Elliott wave Chart of Coffee from the 4/22/2021 update. In which the commodity is showing a strong reaction higher taking place from the blue box area. Right after ending the double three corrections within the blue box area at $120.50 low. Allowed members to create a risk-free position shortly after taking the long positions at the blue box area. However, a break above $140.45 high still needed to confirm the next extension higher & avoid double correction lower.
Information on these pages contains forward-looking statements that involve risks and uncertainties. Markets and instruments profiled on this page are for informational purposes only and should not in any way come across as a recommendation to buy or sell in these assets. You should do your own thorough research before making any investment decisions. FXStreet does not in any way guarantee that this information is free from mistakes, errors, or material misstatements. It also does not guarantee that this information is of a timely nature. Investing in Open Markets involves a great deal of risk, including the loss of all or a portion of your investment, as well as emotional distress. All risks, losses and costs associated with investing, including total loss of principal, are your responsibility. The views and opinions expressed in this article are those of the authors and do not necessarily reflect the official policy or position of FXStreet nor its advertisers.