Chart of the Week: NZD/JPY and gold bulls taking the reins
|- Gold bulls taking the reins from a weekly perspective.
- NZD/JPY bulls looking for a discount and a subsequent daily continuation.
The following analysis looks into the price of gold as well as NZD/JPY.
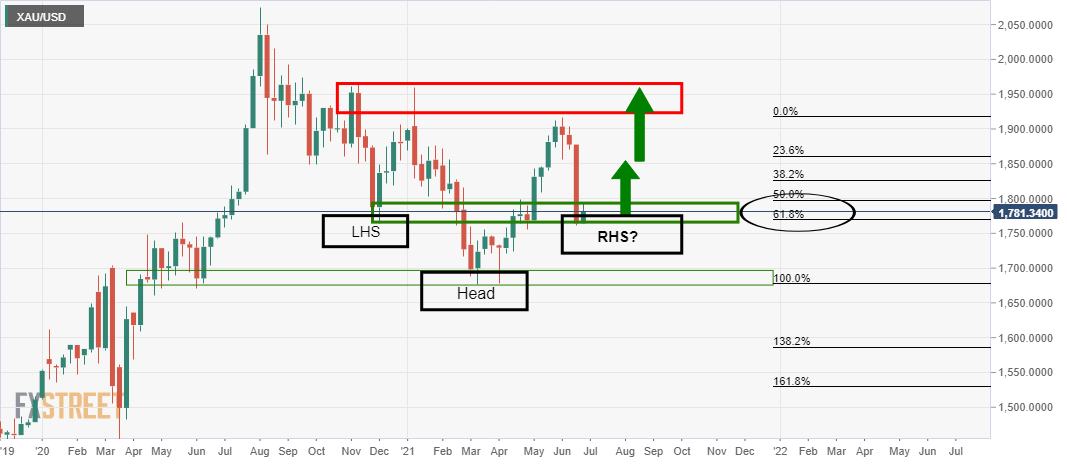
Last week's analysis is still in the process of playing out in the form of a weekly reverse head and shoulders: Chart of the Week: Gold meets critical landmark
Weekly chart, prior analysis
Live market, positive weekly progress
From a daily perspective, the price is en route to the near term 38.2% target near to 1,815:
Daily chart, prior analysis
Live market, positive progress
NZD/JPY bullish outlook
Meanwhile, the readiest cross on the list for taking into consideration is NZD/JPY.
As per the prior analysis, NZD/JPY Price Analysis: Bulls stepping in at a critical confluence of support, the price indeed respected the 77.40/60 support structure:
Prior analysis, 4-hour & weekly charts
... the price has formed new support structure above 77.40 in the process at a well worn historic level as follows:
In the above 4-hour chart, the price tested the prior 23 June lows and was rejected there a number of times.
Also, the price has formed a supporting structure within the bullish impulse near 77.60.
There is also a confluence of the 21 EMA.
Moreover, zooming all the way out to the weekly chart, we can see that this is in fact a key level on the higher time frames also:
Weekly chart
Live market, positive progress (4-hour chart)
Meanwhile, for bulls that had missed the entry opportunity since the prior analysis, there could be a second chance to get on board the train.
The next stop could be at a restest of the W-formation's neckline as follows:
The 61.8% Fibonacci at the expected support structure comes in at 77.74 and a restest of which, if it holds, would be expected to lead to an onward upside continuation on a daily chart basis for the week ahead.
Information on these pages contains forward-looking statements that involve risks and uncertainties. Markets and instruments profiled on this page are for informational purposes only and should not in any way come across as a recommendation to buy or sell in these assets. You should do your own thorough research before making any investment decisions. FXStreet does not in any way guarantee that this information is free from mistakes, errors, or material misstatements. It also does not guarantee that this information is of a timely nature. Investing in Open Markets involves a great deal of risk, including the loss of all or a portion of your investment, as well as emotional distress. All risks, losses and costs associated with investing, including total loss of principal, are your responsibility. The views and opinions expressed in this article are those of the authors and do not necessarily reflect the official policy or position of FXStreet nor its advertisers.