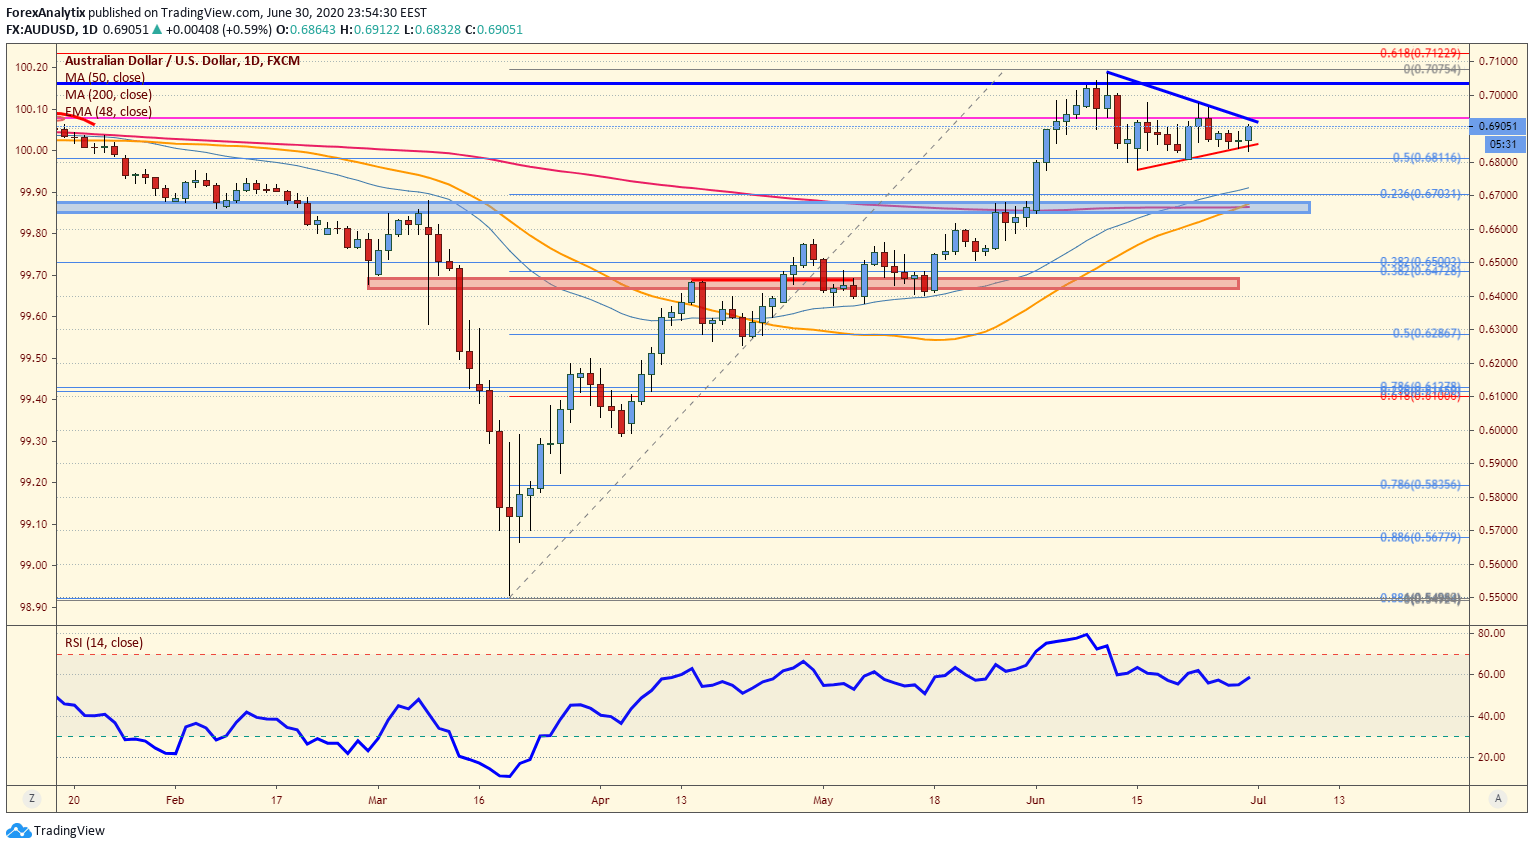
Chart of the Day: AUD/USD
|The AUD/USD is in a triangle consolidation, and if you look at the daily chart of the SPX, it is the same. I'd guess if the stock market breaks out higher the AUDUSD will be doing the same, and visa versa. The AUD/USD rally in the last few months has been epic, but the overbought conditions via the RSI from early June has worked off the extremes, which could allow for another move higher if there is a daily close back above the .6930 level. Support is at .6830.
Information on these pages contains forward-looking statements that involve risks and uncertainties. Markets and instruments profiled on this page are for informational purposes only and should not in any way come across as a recommendation to buy or sell in these assets. You should do your own thorough research before making any investment decisions. FXStreet does not in any way guarantee that this information is free from mistakes, errors, or material misstatements. It also does not guarantee that this information is of a timely nature. Investing in Open Markets involves a great deal of risk, including the loss of all or a portion of your investment, as well as emotional distress. All risks, losses and costs associated with investing, including total loss of principal, are your responsibility. The views and opinions expressed in this article are those of the authors and do not necessarily reflect the official policy or position of FXStreet nor its advertisers.