Bullish breakout in GDXJ (Gold miners juniors) imminent
|Gold market continues to extend higher with uncertainties in pandemic and ultra-loose monetary policy by central banks. It has printed a 7 year high of $1779 and shows no sign of stopping. It has broken to new-all time high against many other major currencies, such as Euro, Pound Sterling, and Yen. Gold stocks should benefit from a rising gold market. Despite the strong performance in 2019 and 2020, they have yet to recover from the 2010 selloff.
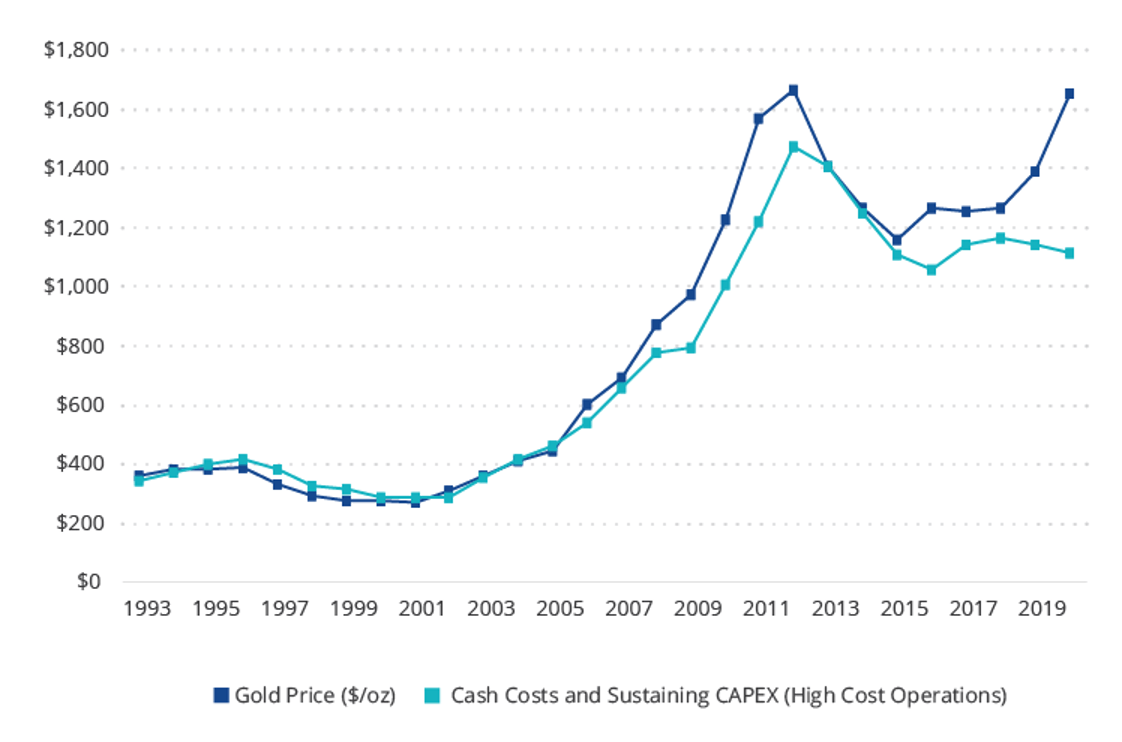
In a bullish gold market, the large-cap companies usually rally first. Afterwards, the mid-tiers and juniors will catch up at a faster and higher clip as market advances. Good news is that unlike the 2001 – 2011 bull market in Gold, Gold miners learn their lesson and keep costs in check even with rising gold price.
Gold should continue to benefit going forward with unorthodox monetary policies, negative interest rates, and unsustainable debt levels. In this environment, mid-tiers and juniors (GDXJ) can soon start to outperform.
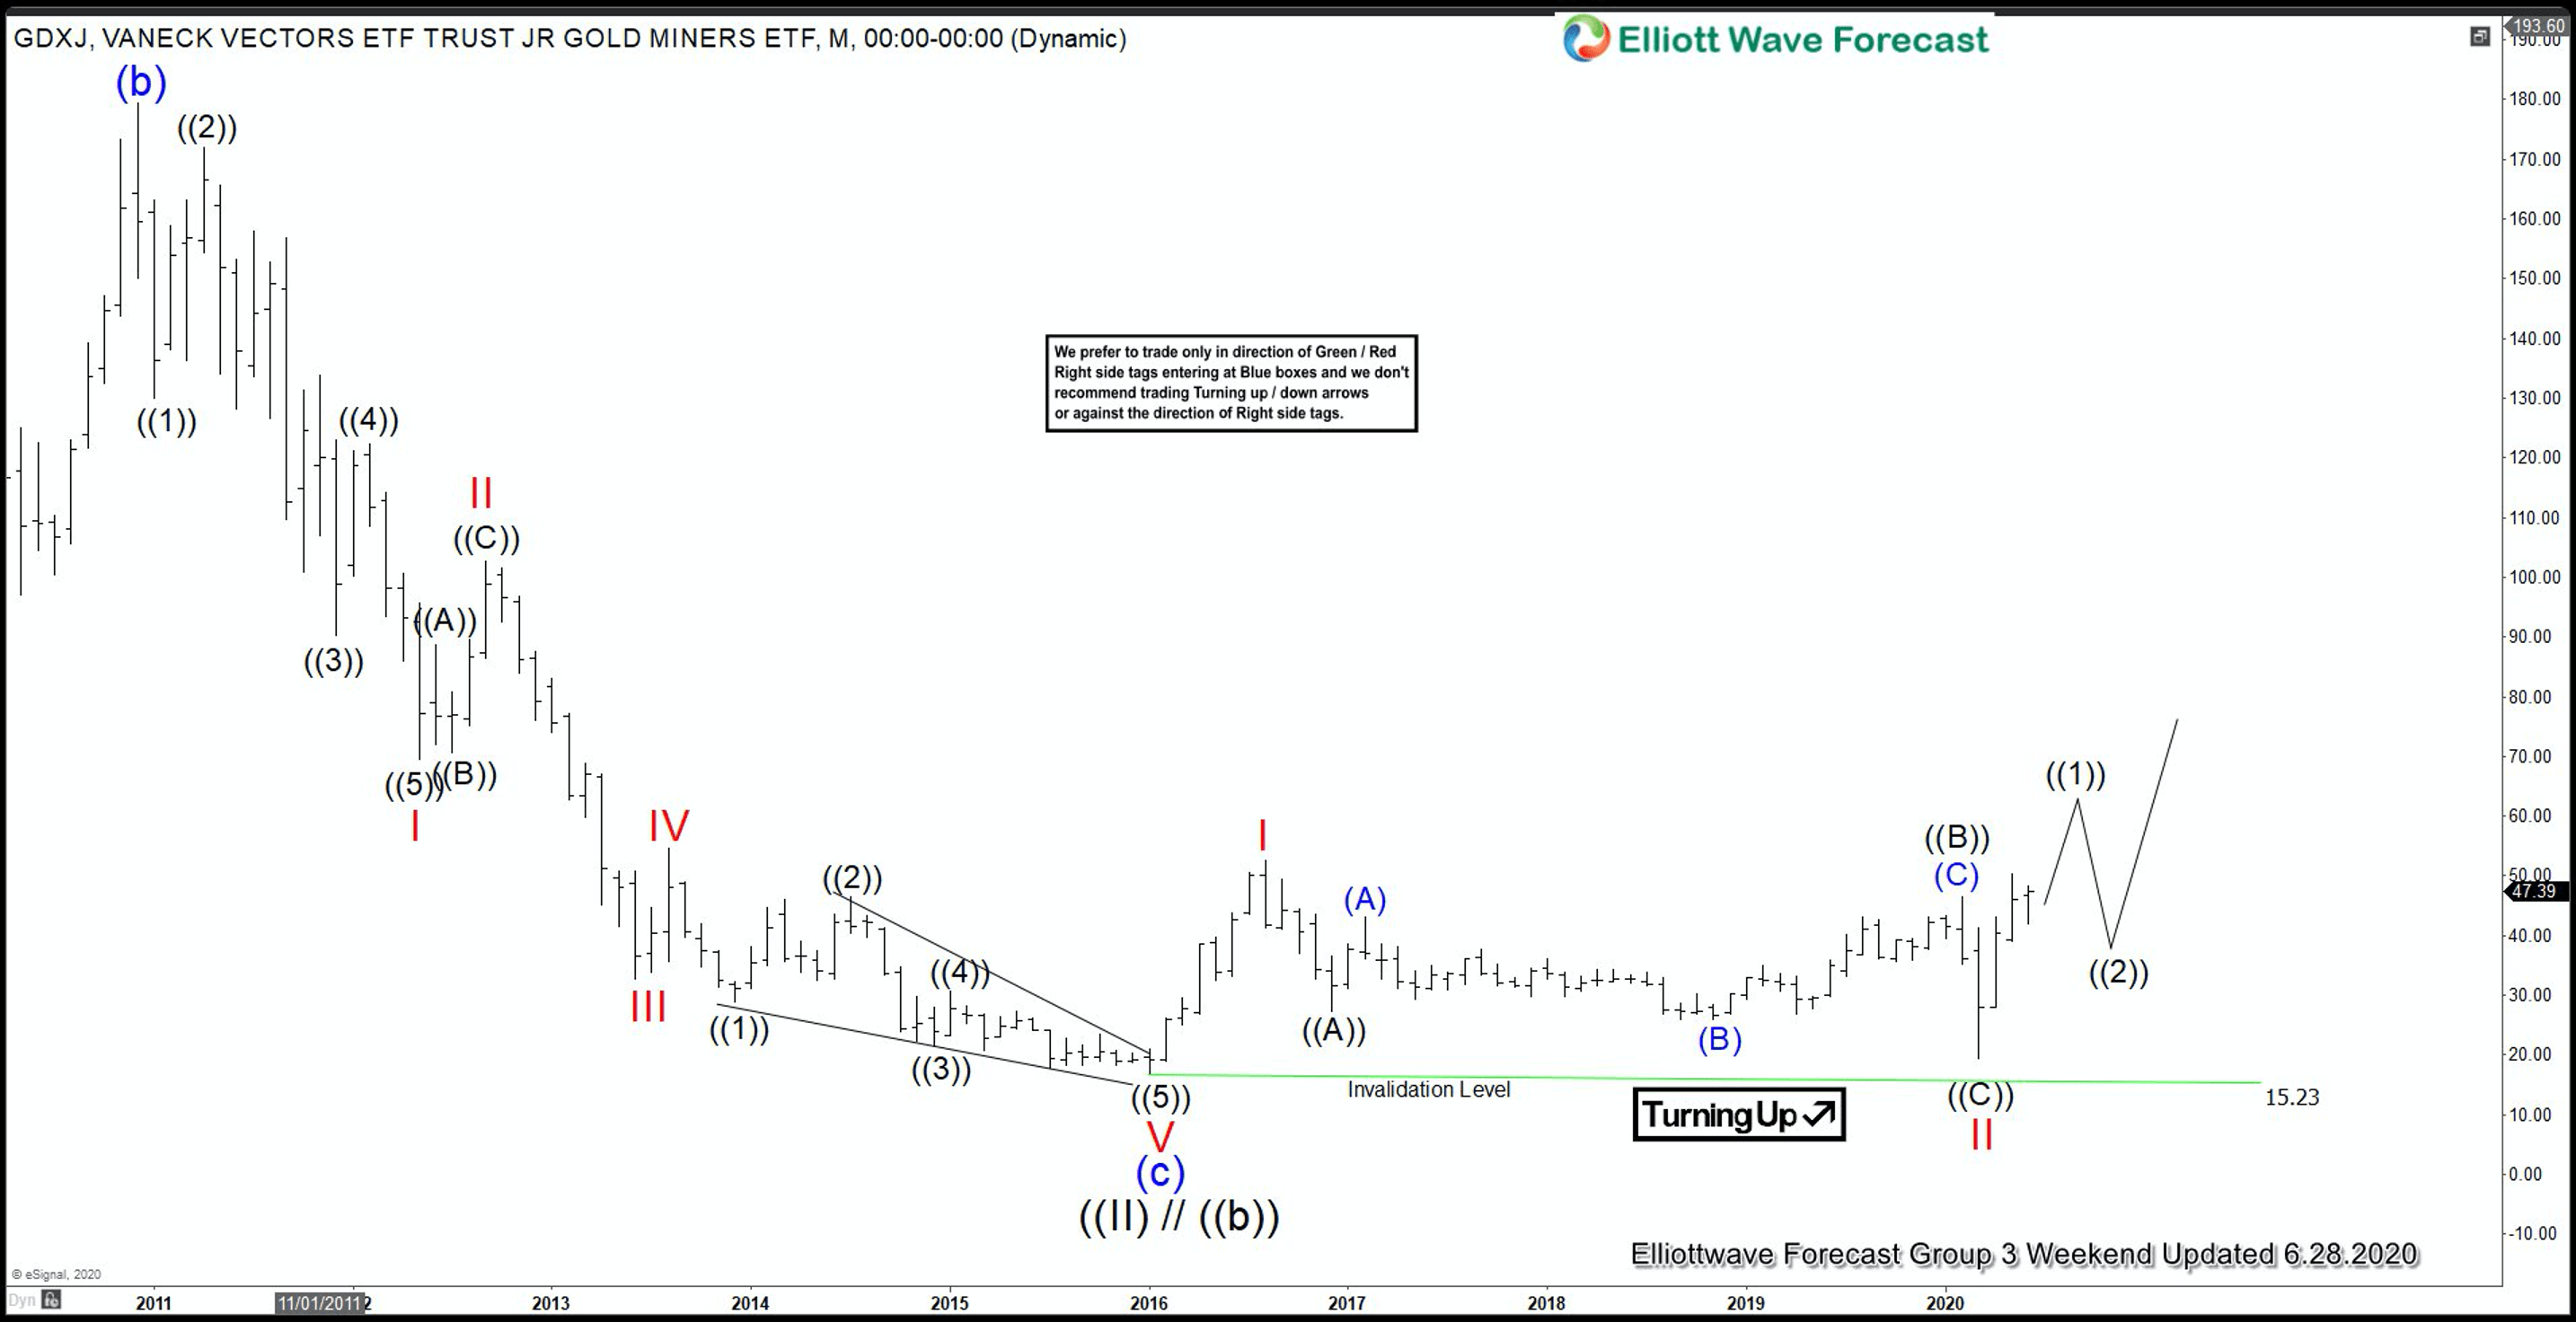
GDXJ Monthly Elliott Wave Chart
Gold Miners Junior (GDXJ) ended the grand super cycle correction in 2016 at $16.87 with either wave ((II)) or wave ((b)). Since then, it has consolidated for 4 years and about to breakout to the upside. Up from January 2016 low, wave I ended at $52.5, and pullback in wave II ended at $19.52 in March 2020 low. A break above wave I at 52.5 in the next few months should confirm the next leg higher has started.
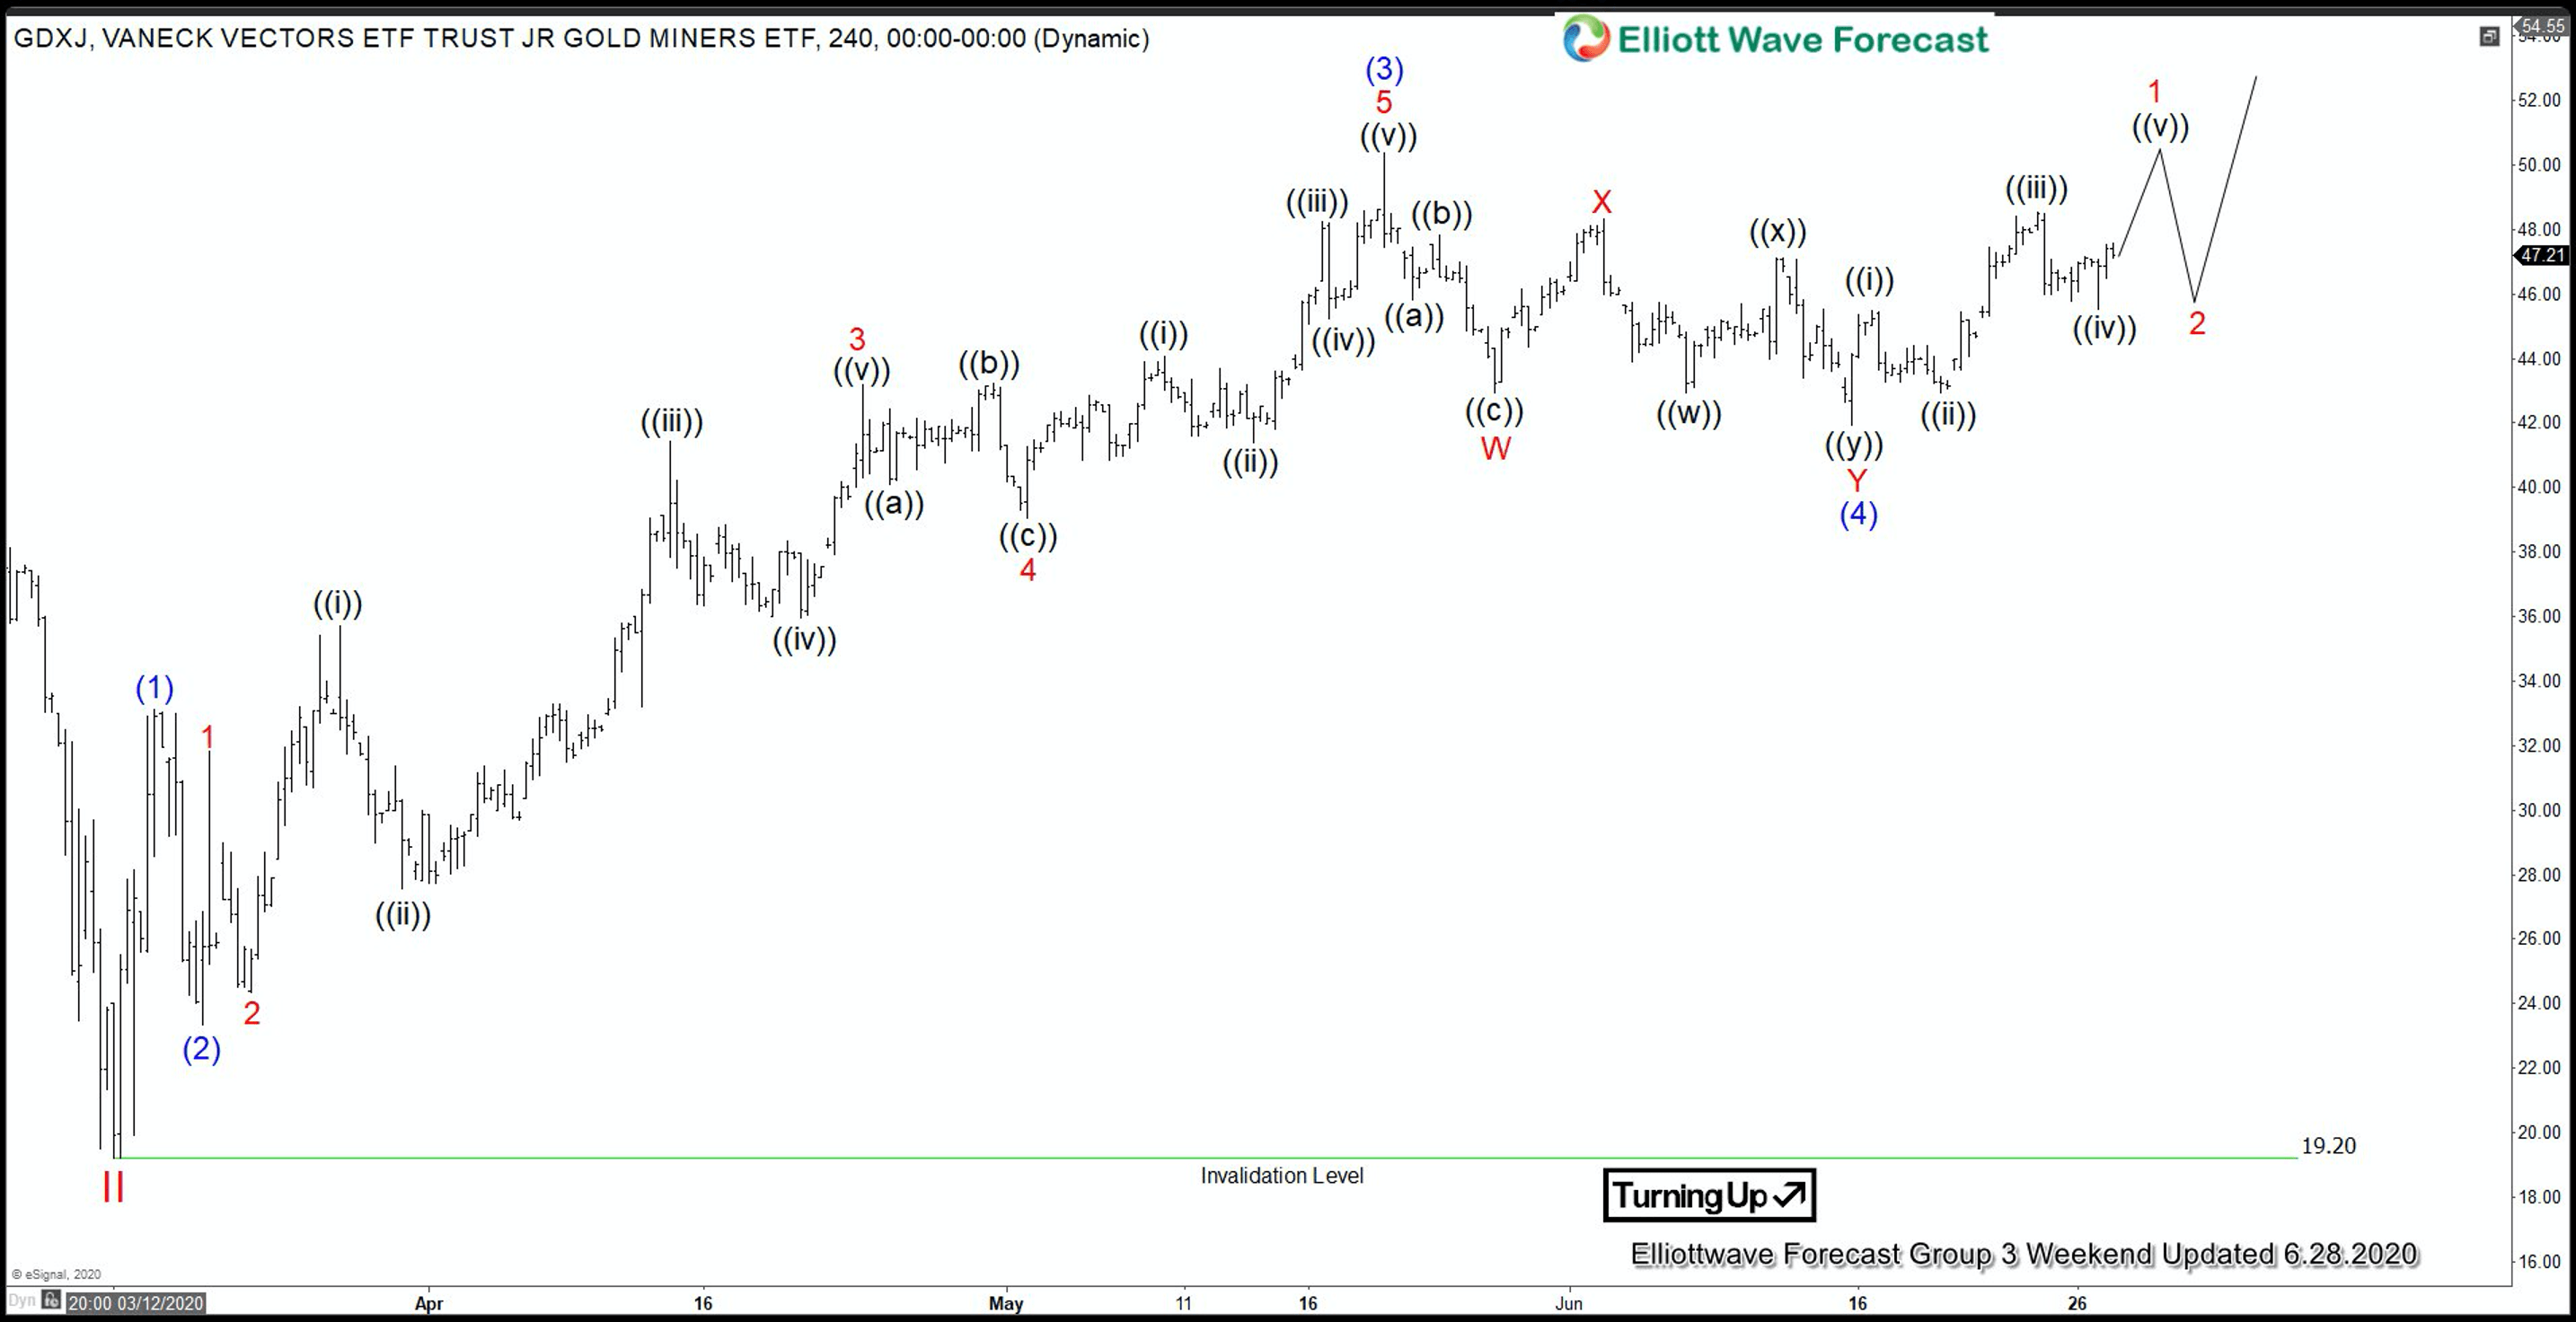
GDXJ Daily Elliott Wave Chart
Daily Elliott Wave chart on GDXJ above suggests the pullback to $19.52 ended wave II on March 13, 2020 low. The pullback coincided with the selloff in global indices due to the Covid-19 breakout around the world. Since then however, the ETF has recovered very strongly and currently at the level above the pre-Covid 19 selloff. The ETF should continue to be supported in the dips against the March 2020 low for further upside.
GDXJ 4 Hour Elliott Wave Chart
GDXJ 4 Hour Chart above shows that the ETF rally from March 16 low is unfolding as a 5 waves impulsive Elliott Wave structure. Further upside still can’t be ruled out before cycle from March 16 low ends. The 5 waves higher should end wave ((1)0, then it should pullback in wave ((2)) to correct cycle from 3/13/2020 low in 3, 7, or 11 swing before the rally resumes.
Information on these pages contains forward-looking statements that involve risks and uncertainties. Markets and instruments profiled on this page are for informational purposes only and should not in any way come across as a recommendation to buy or sell in these assets. You should do your own thorough research before making any investment decisions. FXStreet does not in any way guarantee that this information is free from mistakes, errors, or material misstatements. It also does not guarantee that this information is of a timely nature. Investing in Open Markets involves a great deal of risk, including the loss of all or a portion of your investment, as well as emotional distress. All risks, losses and costs associated with investing, including total loss of principal, are your responsibility. The views and opinions expressed in this article are those of the authors and do not necessarily reflect the official policy or position of FXStreet nor its advertisers.