EUR/NZD technical analysis: The pair is showing signs of breaking lower
|- EUR/NZD breaks lower breaking consolidation patter.
- NZD rose last night after the retail electronic card sales data.
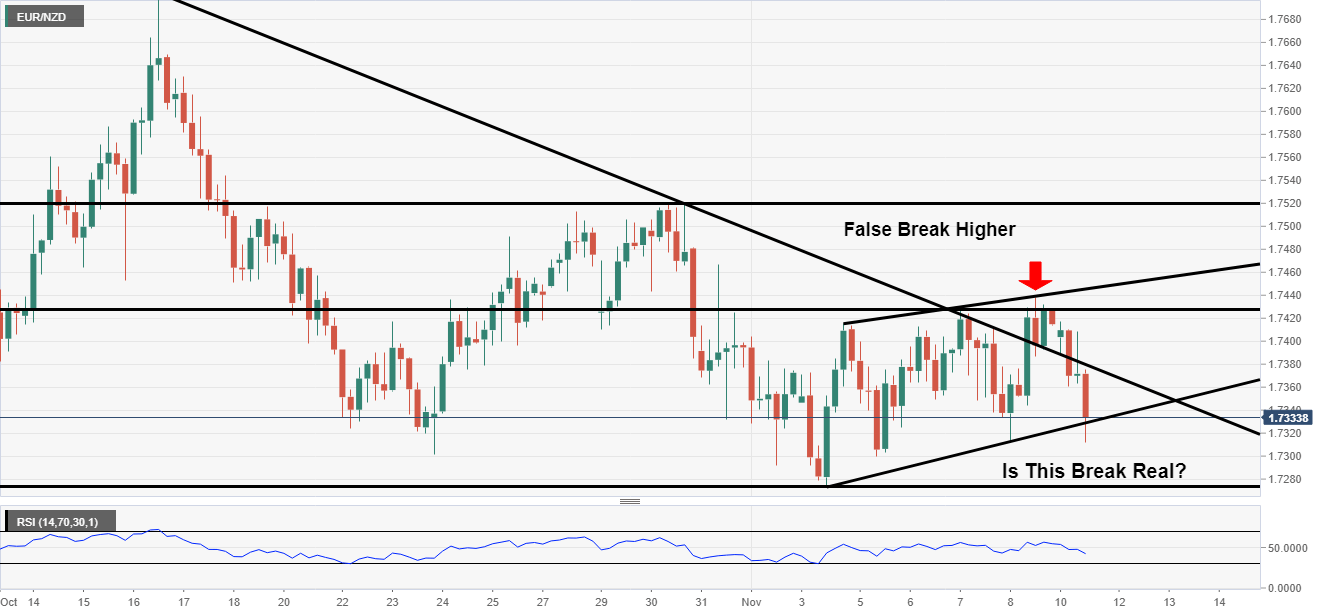
EUR/NZD 4-Hour Chart
EUR/NZD has pushed down today and currently trades 0.43% lower on the session.
Looking at the 4-hour chart below you can see there was a false break higher after the trendline break on November 8th.
Now the price has broken back into the trendline it has broken to the downside and broken the pattern to the downside.
No the support level in focus is at 1.7272 and before that 1.7325.
EUR/NZD Daily Chart
The daily chart is showing more of a bearish picture. The pattern broke to the downside on October 23rd.
Subsequently, the price broken back in and then pushed lower after mean-reverting.
Now the main support zone holds at 1.7279. If the price breaks lower it would confirm a lower high lower low and technical trend change.
-637090708451773535.png)
Information on these pages contains forward-looking statements that involve risks and uncertainties. Markets and instruments profiled on this page are for informational purposes only and should not in any way come across as a recommendation to buy or sell in these assets. You should do your own thorough research before making any investment decisions. FXStreet does not in any way guarantee that this information is free from mistakes, errors, or material misstatements. It also does not guarantee that this information is of a timely nature. Investing in Open Markets involves a great deal of risk, including the loss of all or a portion of your investment, as well as emotional distress. All risks, losses and costs associated with investing, including total loss of principal, are your responsibility. The views and opinions expressed in this article are those of the authors and do not necessarily reflect the official policy or position of FXStreet nor its advertisers.