Trading With MACD
|The Moving Average Convergence/Divergence (MACD) is a strategy which utilises moving average lines, which are created by previous price trends. It was developed by Gerald Appel in the 1970’s and in 1986, Thomas Aspray added a further component to it (the histogram) to bring it its current state.
Why Use MACD?
The MACD strategy can be used to isolate various signals, but it is most reliable when it is used to follow trends, and gauge the momentum of the trend. This is when the strategy is at its most effective, and is most forgiving to beginners and less experiences traders.
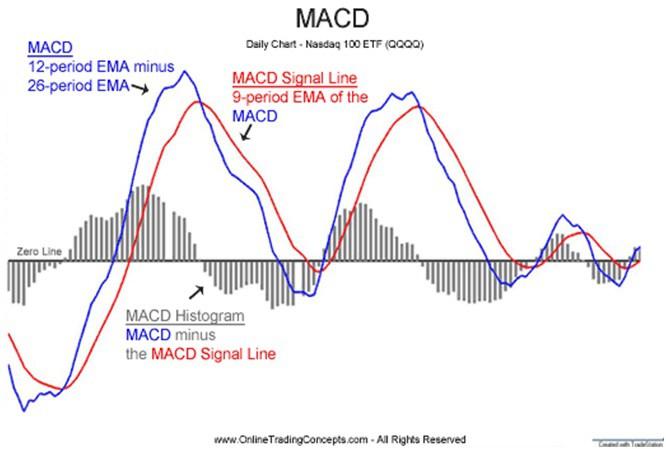
It is comprised of three indicators; the MACD line, the MACD signal line, and a histogram. The zero-line, or centre line, can also be used to inform the trader about price action, but we’ll set this aside for now to minimise confusion. Below is a chart featuring all three indicators with their corresponding labels.
Understanding The Three Indicators
MACD LINE
The MACD line is calculated by taking the difference between the 12-period exponential moving average, and the 26-period exponential moving average (EMA). The EMA tracks the latest price trend. By taking the difference between two EMAs with different timeframes, the trader can detect trend fluctuations.
MACD SIGNAL LINE
The MACD signal line is a 9-period exponential moving average of the MACD line. The convergence and divergence between the two lines is an indication of the momentum in the price action, but crucially and most obviously, it is an indication of the price trend.
When the MACD line crosses above the signal line it is a bullish trend, and when the signal line crosses above the MACD it is bearish.
HISTOGRAM
The histogram is a visual representation of the difference between the MACD line and the MACD signal line. As mentioned above, the gap between the two lines is an indication of momentum, and the histogram clearly measures that momentum in bars. As momentum accelerates the trader is given an idea of the strength of the price action, and any forthcoming changes to the price as momentum decelerates.
The histogram is positive when the MACD line is above the signal line (bullish), and negative when the signal line is above the MACD line (bearish).
How To Trade With MACD
There are various ways to use this strategy, but we’ll only be going through two of them here. The first method is to initiate a position when one of the MACD lines crosses over the other, which represents a change in trend. The second is by using the centre line crossover method – more on this below.
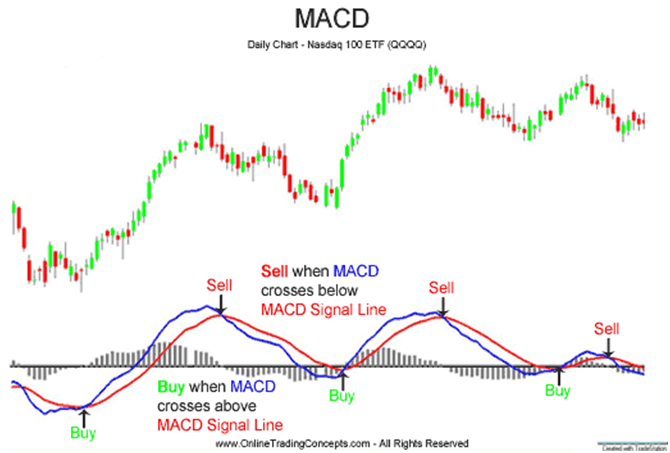
MACD LINE CROSSOVER
This is one of the most widely used trading techniques, and it is pretty self explanatory. Whenever the MACD line crosses over the signal line (or vice versa), it signals the end of a trend, and the trader should consider buying or selling. This is shown on the graph below.
CENTRE LINE CROSSOVER
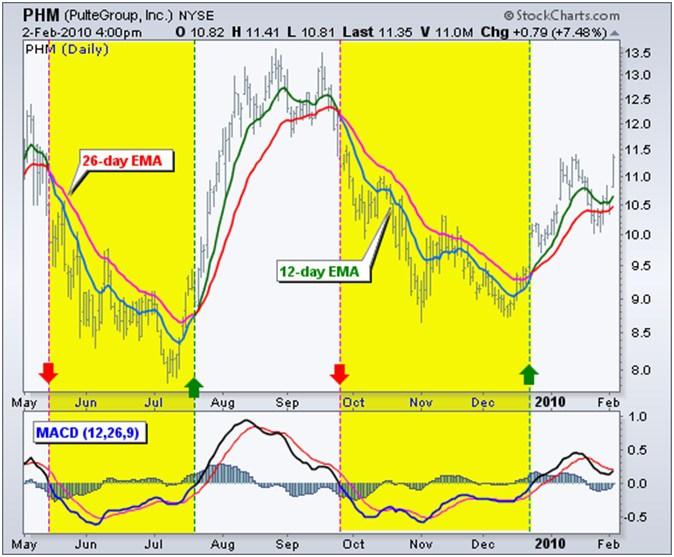
The centre line method ignores the MACD signal line, and focuses only on the MACD line and the centre line. Whenever the MACD line crosses over the centre line, it is used as an indicator to initiate a position – see below.
Recalling that the MACD line represents the difference between the 12-period EMA and the 26-period EMA on the price chart, whenever the MACD line touches the centre line (which represents zero in value) the 12-period EMA and 26-period EMA are equal and the difference is zero.
Notice that this intersection directly correlates with an intersection (or crossover) of the two EMAs (MACD lines) on the price chart.
As with any other trading technique, the MACD strategy comes with its risks as it is based on previous price action. And like most oscillator indicators, it can provide false signals where there are no long-term trends. That being said, it does provide very strong predictive value and when used correctly, can help to lock in some very significant gains.
Information on these pages contains forward-looking statements that involve risks and uncertainties. Markets and instruments profiled on this page are for informational purposes only and should not in any way come across as a recommendation to buy or sell in these assets. You should do your own thorough research before making any investment decisions. FXStreet does not in any way guarantee that this information is free from mistakes, errors, or material misstatements. It also does not guarantee that this information is of a timely nature. Investing in Open Markets involves a great deal of risk, including the loss of all or a portion of your investment, as well as emotional distress. All risks, losses and costs associated with investing, including total loss of principal, are your responsibility. The views and opinions expressed in this article are those of the authors and do not necessarily reflect the official policy or position of FXStreet nor its advertisers.